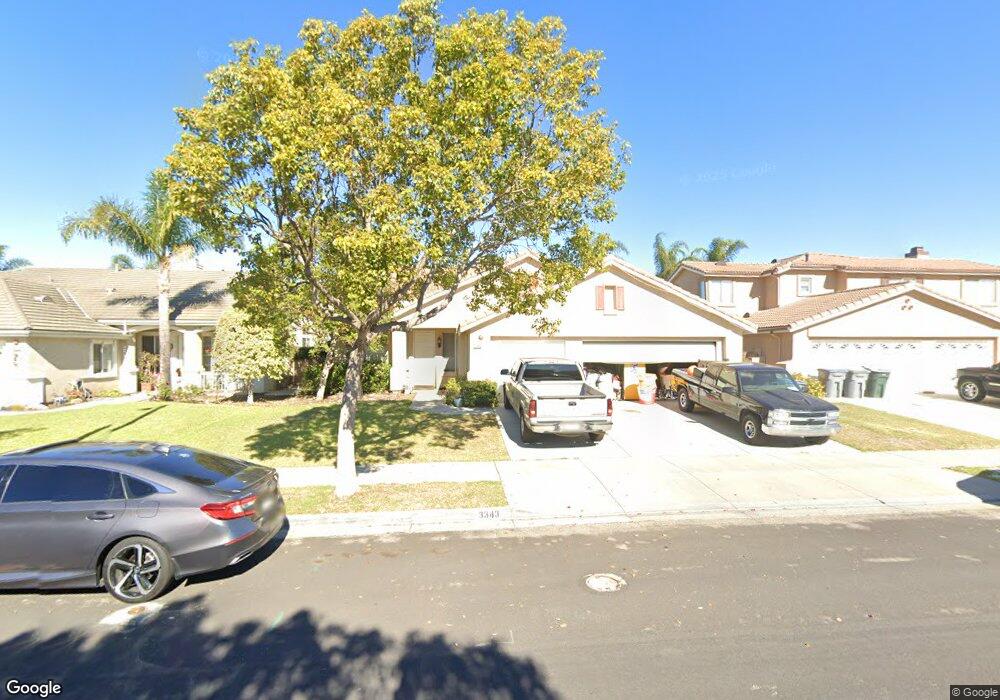
3343 Monte Carlo Dr Oxnard, CA 93035
Sea View Estates NeighborhoodEstimated Value: $832,000 - $930,000
4
Beds
2
Baths
1,790
Sq Ft
$494/Sq Ft
Est. Value
About This Home
This home is located at 3343 Monte Carlo Dr, Oxnard, CA 93035 and is currently estimated at $883,743, approximately $493 per square foot. 3343 Monte Carlo Dr is a home located in Ventura County with nearby schools including Juan Lagunas Soria Elementary School, Oxnard High School, and Santa Clara Elementary School.
Ownership History
Date
Name
Owned For
Owner Type
Purchase Details
Closed on
Nov 12, 2021
Sold by
Caulkins Charles B and Holmes Michelle Ann
Bought by
Caulkins Charles B and Holmes Michelle Ann
Current Estimated Value
Home Financials for this Owner
Home Financials are based on the most recent Mortgage that was taken out on this home.
Original Mortgage
$213,600
Outstanding Balance
$166,007
Interest Rate
2.37%
Mortgage Type
New Conventional
Estimated Equity
$717,736
Purchase Details
Closed on
Nov 6, 2008
Sold by
Department Of Veterans Affairs Of The St
Bought by
Caulkins Charles B and Holmes Michelle A
Home Financials for this Owner
Home Financials are based on the most recent Mortgage that was taken out on this home.
Original Mortgage
$252,150
Interest Rate
6.37%
Mortgage Type
Purchase Money Mortgage
Purchase Details
Closed on
Jun 7, 2005
Sold by
Caulkins Charles B and Holmes Michelle A
Bought by
Caulkins Charles B and Holmes Michelle Ann
Purchase Details
Closed on
Apr 26, 1999
Sold by
Ccb Secret Cove Llc
Bought by
Va
Create a Home Valuation Report for This Property
The Home Valuation Report is an in-depth analysis detailing your home's value as well as a comparison with similar homes in the area
Home Values in the Area
Average Home Value in this Area
Purchase History
| Date | Buyer | Sale Price | Title Company |
|---|---|---|---|
| Caulkins Charles B | -- | Consumers Title Co Of Ca | |
| Caulkins Charles B | -- | Lsi | |
| Caulkins Charles B | -- | -- | |
| Va | $238,000 | Lawyers Title Company |
Source: Public Records
Mortgage History
| Date | Status | Borrower | Loan Amount |
|---|---|---|---|
| Open | Caulkins Charles B | $213,600 | |
| Closed | Caulkins Charles B | $252,150 |
Source: Public Records
Tax History
| Year | Tax Paid | Tax Assessment Tax Assessment Total Assessment is a certain percentage of the fair market value that is determined by local assessors to be the total taxable value of land and additions on the property. | Land | Improvement |
|---|---|---|---|---|
| 2025 | $4,535 | $371,973 | $146,267 | $225,706 |
| 2024 | $4,535 | $364,680 | $143,399 | $221,281 |
| 2023 | $4,370 | $357,530 | $140,587 | $216,943 |
| 2022 | $4,239 | $350,520 | $137,830 | $212,690 |
| 2021 | $4,206 | $343,648 | $135,128 | $208,520 |
| 2020 | $4,283 | $340,127 | $133,744 | $206,383 |
| 2019 | $4,163 | $333,459 | $131,122 | $202,337 |
| 2018 | $4,105 | $326,921 | $128,551 | $198,370 |
| 2017 | $3,897 | $320,512 | $126,031 | $194,481 |
| 2016 | $3,761 | $314,228 | $123,560 | $190,668 |
| 2015 | $3,801 | $309,510 | $121,705 | $187,805 |
| 2014 | $3,759 | $303,449 | $119,322 | $184,127 |
Source: Public Records
Map
Nearby Homes
- 3554 Dunkirk Dr
- 2919 Naples Dr
- 1077 Offshore St
- 3746 Dunkirk Dr
- 3774 Dunkirk Dr
- 600 Freeport Ln
- 740 Freeport Ln
- 2923 Kelp Ln Unit 11
- 1170 Windward Way
- 2900 Windward Way
- 4060 Tradewinds Dr
- 3800 Alee Ln
- 1437 Windshore Way
- 1423 Windshore Way
- 1421 Windshore Way
- 1503 Windshore Way
- 1541 Windshore Way
- 676 Snipe Walk
- 1506 Seabridge Ln
- 1512 Seabridge Ln
- 3333 Monte Carlo Dr
- 3403 Monte Carlo Dr
- 3344 Dunkirk Dr
- 3334 Dunkirk Dr
- 3323 Monte Carlo Dr
- 3413 Monte Carlo Dr
- 3404 Dunkirk Dr
- 3324 Dunkirk Dr
- 3414 Dunkirk Dr
- 3342 Monte Carlo Dr
- 3402 Monte Carlo Dr
- 3313 Monte Carlo Dr
- 3423 Monte Carlo Dr
- 3332 Monte Carlo Dr
- 3424 Dunkirk Dr
- 3314 Dunkirk Dr
- 3412 Monte Carlo Dr
- 3433 Monte Carlo Dr
- 3434 Dunkirk Dr
- 3422 Monte Carlo Dr
Your Personal Tour Guide
Ask me questions while you tour the home.