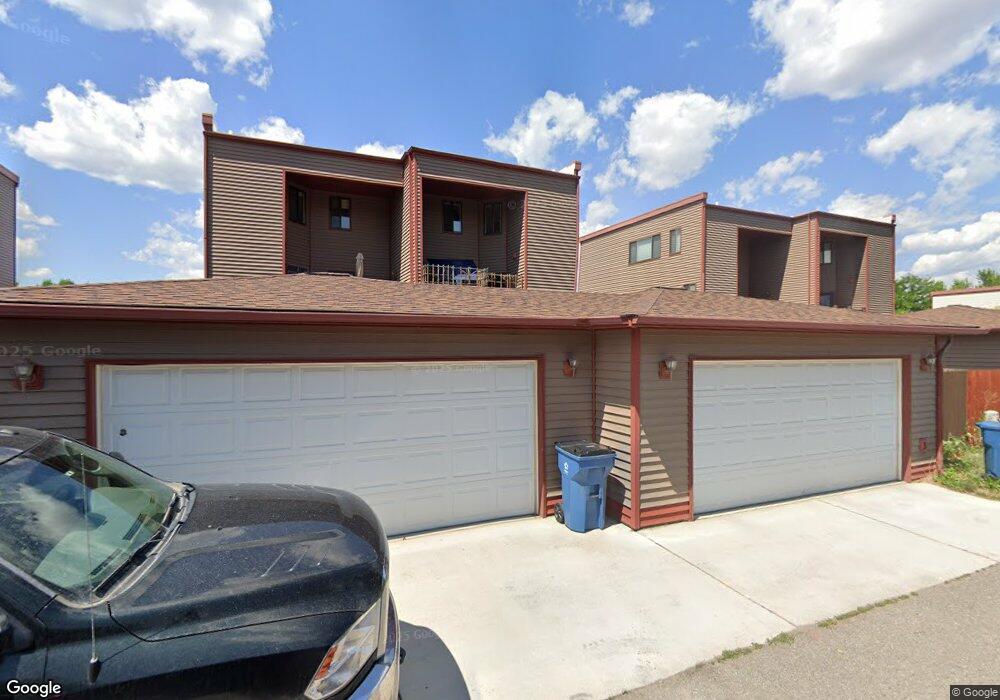
3344 Connery Way Unit B Missoula, MT 59808
Captain John Mullan NeighborhoodEstimated Value: $451,492 - $487,000
2
Beds
3
Baths
1,234
Sq Ft
$374/Sq Ft
Est. Value
About This Home
This home is located at 3344 Connery Way Unit B, Missoula, MT 59808 and is currently estimated at $461,873, approximately $374 per square foot. 3344 Connery Way Unit B is a home located in Missoula County with nearby schools including Hellgate Elementary Lower Grades, Hellgate Middle School, and Big Sky High School.
Ownership History
Date
Name
Owned For
Owner Type
Purchase Details
Closed on
Mar 18, 2011
Sold by
Gray Randall L and Gray Anna C
Bought by
Selanders Erik and Selanders Hilarie
Current Estimated Value
Home Financials for this Owner
Home Financials are based on the most recent Mortgage that was taken out on this home.
Original Mortgage
$177,650
Outstanding Balance
$121,504
Interest Rate
4.77%
Mortgage Type
New Conventional
Estimated Equity
$340,369
Purchase Details
Closed on
Oct 6, 2008
Sold by
Pleasant View Homes Inc
Bought by
Gray Randall L and Gray Anna C
Home Financials for this Owner
Home Financials are based on the most recent Mortgage that was taken out on this home.
Original Mortgage
$152,480
Interest Rate
6.31%
Mortgage Type
Purchase Money Mortgage
Create a Home Valuation Report for This Property
The Home Valuation Report is an in-depth analysis detailing your home's value as well as a comparison with similar homes in the area
Home Values in the Area
Average Home Value in this Area
Purchase History
| Date | Buyer | Sale Price | Title Company |
|---|---|---|---|
| Selanders Erik | -- | Mt | |
| Gray Randall L | -- | Stm |
Source: Public Records
Mortgage History
| Date | Status | Borrower | Loan Amount |
|---|---|---|---|
| Open | Selanders Erik | $177,650 | |
| Previous Owner | Gray Randall L | $152,480 |
Source: Public Records
Tax History Compared to Growth
Tax History
| Year | Tax Paid | Tax Assessment Tax Assessment Total Assessment is a certain percentage of the fair market value that is determined by local assessors to be the total taxable value of land and additions on the property. | Land | Improvement |
|---|---|---|---|---|
| 2025 | $4,291 | $458,500 | $102,500 | $356,000 |
| 2024 | $4,177 | $350,700 | $85,000 | $265,700 |
| 2023 | $3,983 | $350,700 | $85,000 | $265,700 |
| 2022 | $3,581 | $263,900 | $0 | $0 |
| 2021 | $3,154 | $263,900 | $0 | $0 |
| 2020 | $3,148 | $237,400 | $0 | $0 |
| 2019 | $3,115 | $237,400 | $0 | $0 |
| 2018 | $2,896 | $214,000 | $0 | $0 |
| 2017 | $2,855 | $214,000 | $0 | $0 |
| 2016 | $2,404 | $189,800 | $0 | $0 |
| 2015 | $2,276 | $189,800 | $0 | $0 |
| 2014 | $2,104 | $95,983 | $0 | $0 |
Source: Public Records
Map
Nearby Homes
- 3414 Connery Way Unit A
- 3502 A Connery Way Unit A
- 2821 Connery Way
- 3846 Lexington Ave
- 3744 Connery Cir Unit A
- 15 Julie Ave
- 3934 Chelsea Dr
- 3568 Connery Way Unit A
- 3568 Connery Way Unit B
- 3010 Tina Ave Unit 306
- 4002 Melrose Place
- 2904 Tina Ave Unit 201
- 2905 O'Shaughnesy St Unit 102
- 2905 O'Shaughnesy St Unit 104
- 2610 Sheffield Dr
- 4001 Galway Ave
- Tr A Remainder England Blvd
- 4103 Killarney Way
- 2630 Stratford Ln
- 2731 Dublin St
- 3344 Connery Way Unit A
- 3344 Connery Way
- 3322B Connery Way
- 3354 Connery Way Unit A
- 3354 Connery Way Unit B
- 3354 Connery Way
- 3354A Connery Way
- 3354 Connery Way Unit A
- 3322 Connery Way
- 3322 Connery Way
- 3322A Connery Way
- 3322 Connery Way Unit B
- 3308B Connery Way
- 3354B Connery Way
- 3308 Connery Way
- 3308 Connery Way
- 3308A Connery Way
- 3308 Connery Way Unit A
- 3319 Connery Way
- 3303 Connery Way