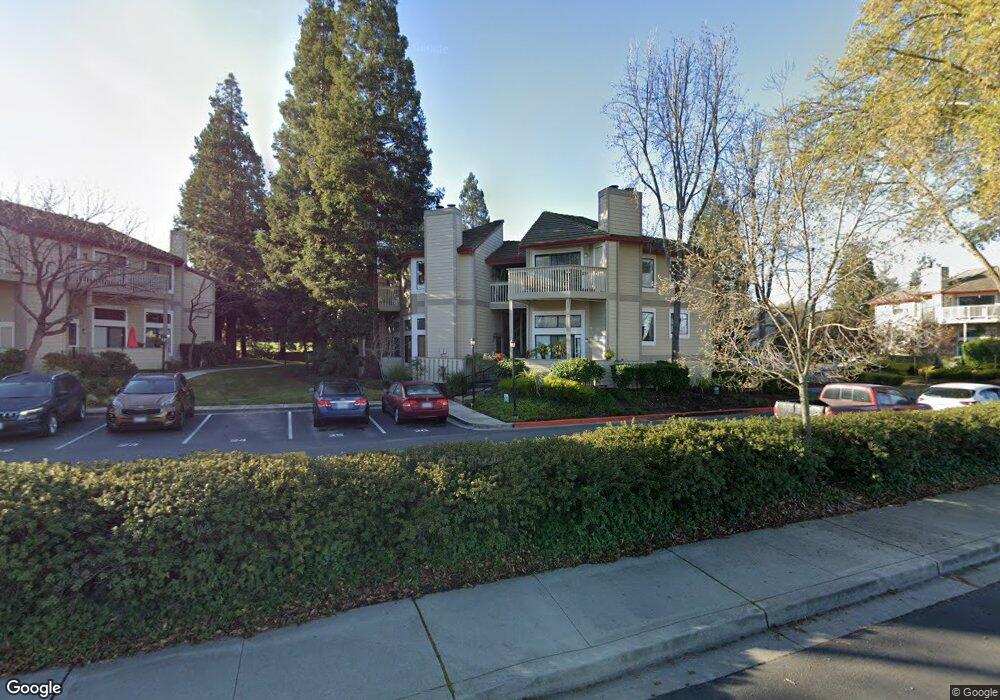
3344 Smoketree Commons Unit 123 Pleasanton, CA 94566
Vintage Hills NeighborhoodEstimated Value: $572,000 - $706,000
2
Beds
2
Baths
856
Sq Ft
$716/Sq Ft
Est. Value
About This Home
This home is located at 3344 Smoketree Commons Unit 123, Pleasanton, CA 94566 and is currently estimated at $612,918, approximately $716 per square foot. 3344 Smoketree Commons Unit 123 is a home located in Alameda County with nearby schools including Vintage Hills Elementary School, Pleasanton Middle School, and Amador Valley High School.
Ownership History
Date
Name
Owned For
Owner Type
Purchase Details
Closed on
Feb 9, 2016
Sold by
Smith Kendall J and Smith Arlene G
Bought by
Yulong Usa Co Ltd
Current Estimated Value
Purchase Details
Closed on
Dec 20, 2002
Sold by
Smith Kendall and Smith Arlene
Bought by
Smith Kendall J and Smith Arlene G
Purchase Details
Closed on
Sep 1, 2000
Sold by
Logan Derek C and Logan Sarah A
Bought by
Smith Kendall and Smith Arlene
Purchase Details
Closed on
Jun 22, 1994
Sold by
Miller Christopher R and Miller Nancy M
Bought by
Logan Derek C and Blake Sarah A
Home Financials for this Owner
Home Financials are based on the most recent Mortgage that was taken out on this home.
Original Mortgage
$108,000
Interest Rate
8.53%
Create a Home Valuation Report for This Property
The Home Valuation Report is an in-depth analysis detailing your home's value as well as a comparison with similar homes in the area
Home Values in the Area
Average Home Value in this Area
Purchase History
| Date | Buyer | Sale Price | Title Company |
|---|---|---|---|
| Yulong Usa Co Ltd | $545,000 | Chicago Title Company | |
| Smith Kendall J | -- | -- | |
| Smith Kendall | $257,000 | Old Republic Title Company | |
| Logan Derek C | $143,000 | North American Title Company |
Source: Public Records
Mortgage History
| Date | Status | Borrower | Loan Amount |
|---|---|---|---|
| Previous Owner | Logan Derek C | $108,000 |
Source: Public Records
Tax History Compared to Growth
Tax History
| Year | Tax Paid | Tax Assessment Tax Assessment Total Assessment is a certain percentage of the fair market value that is determined by local assessors to be the total taxable value of land and additions on the property. | Land | Improvement |
|---|---|---|---|---|
| 2025 | $7,479 | $645,154 | $193,546 | $451,608 |
| 2024 | $7,479 | $632,504 | $189,751 | $442,753 |
| 2023 | $7,393 | $620,105 | $186,031 | $434,074 |
| 2022 | $7,004 | $607,947 | $182,384 | $425,563 |
| 2021 | $6,825 | $596,027 | $178,808 | $417,219 |
| 2020 | $6,738 | $589,918 | $176,975 | $412,943 |
| 2019 | $6,820 | $578,353 | $173,506 | $404,847 |
| 2018 | $6,683 | $567,017 | $170,105 | $396,912 |
| 2017 | $6,513 | $555,900 | $166,770 | $389,130 |
| 2016 | $3,627 | $326,607 | $98,007 | $228,600 |
| 2015 | $3,560 | $321,704 | $96,536 | $225,168 |
| 2014 | $3,623 | $315,404 | $94,646 | $220,758 |
Source: Public Records
Map
Nearby Homes
- 543 Tawny Dr
- 3399 Norton Way Unit 6
- 3263 Vineyard Ave Unit 44
- 3263 Vineyard Ave
- 3263 Vineyard Ave Unit 125
- 3263 Vineyard Ave Unit 174
- 3263 Vineyard Ave Unit 68
- 3231 Vineyard Ave Unit 126
- 3231 Vineyard Ave Unit 29
- 3231 Vineyard Ave Unit 33
- 3231 Vineyard Ave Unit 132
- 665 Palomino Dr Unit D
- 601 Palomino Dr Unit C
- 215 Mavis Dr
- 389 Mavis Dr
- 462 Tioga Ct
- 1312 Vintner Way
- 2864 El Capitan Dr
- 2863 El Capitan Dr
- 3839 Vineyard Ave Unit F
- 3344 Smoketree Commons Unit DR
- 3348 Smoketree Commons
- 3352 Smoketree Commons
- 3346 Smoketree Commons Unit 132
- 3358 Smoketree Commons
- 3356 Smoketree Commons
- 3364 Smoketree Cms Dr
- 3348 Smoketree Cms Dr
- 3342 Smoketree Commons
- 3356 Smoketree Commons Unit 130
- 3354 Smoketree Commons Unit 121
- 3366 Smoketree Commons
- 3376 Smoketree Commons
- 3362 Smoketree Commons
- 3328 Smoketree Commons Unit 114
- 3336 Smoketree Commons
- 3314 Smoketree Commons Unit 104
- 3364 Smoketree Commons
- 3368 Smoketree Commons
- 3336 Smoketree Com