Y
Landlord's Agent in 2018
Yaming Sun
Total Realty USA, Inc.
(678) 665-1484
4 in this area
31 Total Sales
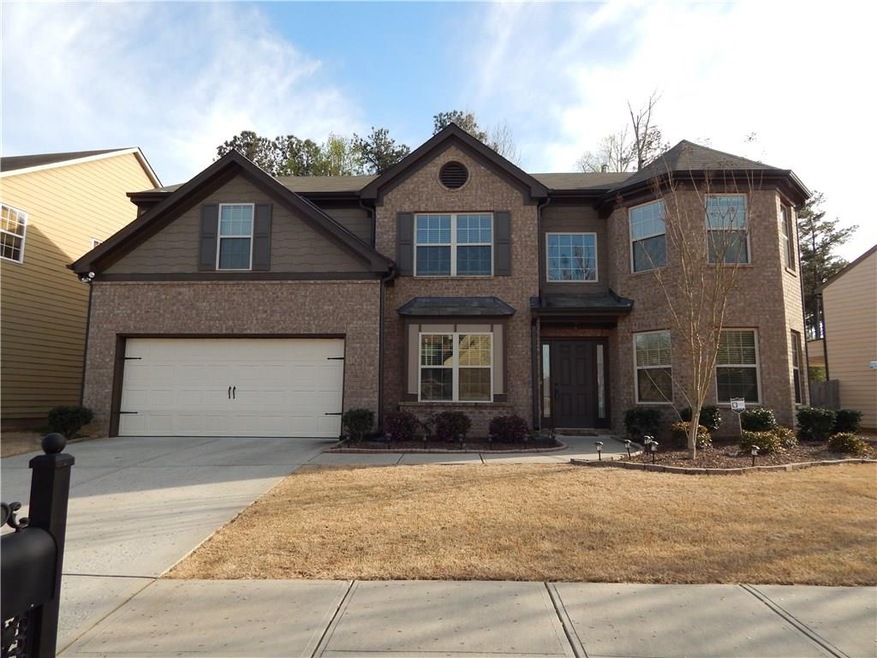
Estimated Value: $488,496 - $577,000
Top Ranking Mill Creek High School District. One of the largest Floor Plan in The Hamptons. Fenced Backyard for Family Gathering. Swim & Tennis Subdivision with Play Ground and Sidewalks. Formal Living and Formal Dining Downstairs with Cozy Family Room open to the Gourmet Kitchen and One Guest Suite. Huge Master Bedroom/Sitting Area with 3 Spacious Secondary Bedrooms upstairs. A Huge Second Family Room Upstairs for Family Downtime. Strictly NO PET rental. Landlord Requires Credit Score of 650 or above. Verifiable Income at least 3 Times of the rent is required.
Last Agent to Rent the Property
Total Realty USA, Inc. License #342311 Listed on: 04/02/2018
Last Renter's Agent
NON-MLS NMLS
Non FMLS Member
| Date | Buyer | Sale Price | Title Company |
|---|---|---|---|
| Lin Chao Ping | $285,100 | -- | |
| Paez Andres Amadeo Jejen | $237,900 | -- | |
| Cruz William Diego | $198,000 | -- | |
| Almont Homes Ne Inc | $40,000 | -- |
| Date | Status | Borrower | Loan Amount |
|---|---|---|---|
| Previous Owner | Paez Andres Amadeo Jejen | $233,590 | |
| Previous Owner | Almont Homes Ne Inc | $198,000 |
| Date | Event | Price | Change | Sq Ft Price |
|---|---|---|---|---|
| 05/30/2018 05/30/18 | Rented | $1,850 | 0.0% | -- |
| 04/29/2018 04/29/18 | Price Changed | $1,850 | -2.6% | $1 / Sq Ft |
| 04/02/2018 04/02/18 | For Rent | $1,900 | 0.0% | -- |
| 03/30/2018 03/30/18 | Sold | $285,100 | 0.0% | $99 / Sq Ft |
| 02/20/2018 02/20/18 | Pending | -- | -- | -- |
| 02/19/2018 02/19/18 | For Sale | $285,000 | 0.0% | $99 / Sq Ft |
| 02/19/2018 02/19/18 | Pending | -- | -- | -- |
| 02/13/2018 02/13/18 | For Sale | $285,000 | +19.8% | $99 / Sq Ft |
| 04/12/2016 04/12/16 | Sold | $237,900 | 0.0% | $82 / Sq Ft |
| 02/01/2016 02/01/16 | Pending | -- | -- | -- |
| 01/04/2016 01/04/16 | Price Changed | $237,900 | -0.9% | $82 / Sq Ft |
| 11/05/2015 11/05/15 | For Sale | $240,000 | +21.2% | $83 / Sq Ft |
| 01/14/2013 01/14/13 | Sold | $198,000 | 0.0% | -- |
| 12/15/2012 12/15/12 | Pending | -- | -- | -- |
| 11/16/2012 11/16/12 | For Sale | $198,000 | -- | -- |
| Year | Tax Paid | Tax Assessment Tax Assessment Total Assessment is a certain percentage of the fair market value that is determined by local assessors to be the total taxable value of land and additions on the property. | Land | Improvement |
|---|---|---|---|---|
| 2024 | $6,933 | $185,160 | $37,600 | $147,560 |
| 2023 | $6,933 | $185,160 | $37,600 | $147,560 |
| 2022 | $5,866 | $155,880 | $34,000 | $121,880 |
| 2021 | $4,729 | $121,960 | $24,800 | $97,160 |
| 2020 | $4,270 | $108,560 | $22,400 | $86,160 |
| 2019 | $4,112 | $108,560 | $22,400 | $86,160 |
| 2018 | $3,561 | $101,120 | $22,400 | $78,720 |
| 2016 | $3,189 | $94,680 | $19,200 | $75,480 |
| 2015 | $3,009 | $85,160 | $16,000 | $69,160 |
| 2014 | -- | $79,200 | $16,000 | $63,200 |
Y
Landlord's Agent in 2018
Yaming Sun
Total Realty USA, Inc.
(678) 665-1484
4 in this area
31 Total Sales
E
Seller's Agent in 2018
Erika Miniza
NOT A VALID MEMBER
N
Tenant's Agent in 2018
NON-MLS NMLS
Non FMLS Member

Buyer's Agent in 2018
Daisy Luo
Total Realty USA, Inc.
(678) 665-1486
5 Total Sales
Seller's Agent in 2016
Shawn Buchan
Keller Williams Realty Atlanta Partners
(678) 661-1459
7 in this area
84 Total Sales
C
Buyer's Agent in 2016
Caroline Maki
NOT A VALID MEMBER
Source: First Multiple Listing Service (FMLS)
MLS Number: 5988676
APN: 7-181-428
Disclaimer: Certain information contained herein is derived from information provided by parties other than Homes.com. All information provided is deemed reliable, but is not guaranteed to be accurate and should be independently verified.
![]() Listings identified with the FMLS IDX logo come from FMLS and are held by brokerage firms other than the owner of this website. The listing brokerage is identified in any listing details. Information is deemed reliable but is not guaranteed. If you believe any FMLS listing contains material that infringes your copyrighted work please visit www.fmls.com/dmca to review our DMCA policy and learn how to submit a takedown request. © 2025 First Multiple Listing Service, Inc.
Listings identified with the FMLS IDX logo come from FMLS and are held by brokerage firms other than the owner of this website. The listing brokerage is identified in any listing details. Information is deemed reliable but is not guaranteed. If you believe any FMLS listing contains material that infringes your copyrighted work please visit www.fmls.com/dmca to review our DMCA policy and learn how to submit a takedown request. © 2025 First Multiple Listing Service, Inc.