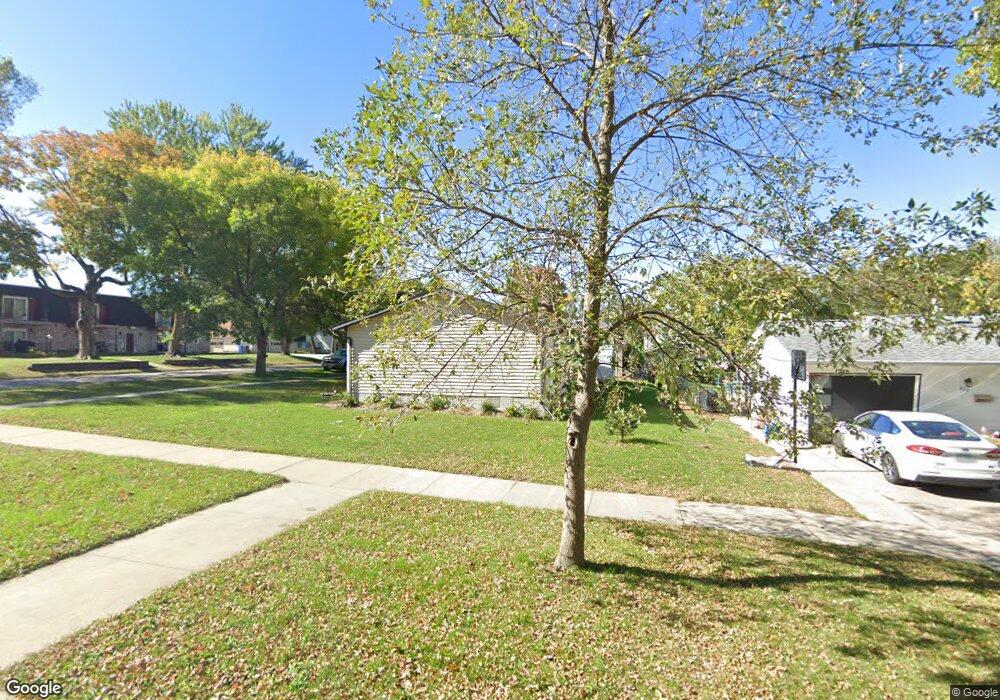
335 3rd Ave SE Le Mars, IA 51031
Estimated Value: $174,703 - $195,000
2
Beds
1
Bath
1,032
Sq Ft
$179/Sq Ft
Est. Value
About This Home
This home is located at 335 3rd Ave SE, Le Mars, IA 51031 and is currently estimated at $185,176, approximately $179 per square foot. 335 3rd Ave SE is a home located in Plymouth County with nearby schools including Le Mars High School, Gehlen Catholic Schools, and Gehlen Elementary School.
Ownership History
Date
Name
Owned For
Owner Type
Purchase Details
Closed on
Apr 22, 2021
Sold by
Reside Properties Llc
Bought by
Draayer Joshua
Current Estimated Value
Home Financials for this Owner
Home Financials are based on the most recent Mortgage that was taken out on this home.
Original Mortgage
$155,200
Outstanding Balance
$140,050
Interest Rate
3.1%
Mortgage Type
New Conventional
Estimated Equity
$45,126
Purchase Details
Closed on
Jul 16, 2020
Sold by
Vickery John I and Vickery Emily A
Bought by
Reside Properties Llc
Purchase Details
Closed on
Oct 12, 2015
Sold by
Kramer Henry and Kramer Sharon L
Bought by
Vickery John L
Home Financials for this Owner
Home Financials are based on the most recent Mortgage that was taken out on this home.
Original Mortgage
$64,804
Interest Rate
3.91%
Mortgage Type
FHA
Create a Home Valuation Report for This Property
The Home Valuation Report is an in-depth analysis detailing your home's value as well as a comparison with similar homes in the area
Home Values in the Area
Average Home Value in this Area
Purchase History
| Date | Buyer | Sale Price | Title Company |
|---|---|---|---|
| Draayer Joshua | $160,000 | None Available | |
| Reside Properties Llc | $89,000 | None Available | |
| Vickery John L | $66,000 | None Available |
Source: Public Records
Mortgage History
| Date | Status | Borrower | Loan Amount |
|---|---|---|---|
| Open | Draayer Joshua | $155,200 | |
| Previous Owner | Vickery John L | $64,804 |
Source: Public Records
Tax History
| Year | Tax Paid | Tax Assessment Tax Assessment Total Assessment is a certain percentage of the fair market value that is determined by local assessors to be the total taxable value of land and additions on the property. | Land | Improvement |
|---|---|---|---|---|
| 2025 | $1,946 | $159,630 | $15,750 | $143,880 |
| 2024 | $1,506 | $142,980 | $15,750 | $127,230 |
| 2023 | $1,416 | $117,790 | $11,550 | $106,240 |
| 2022 | $1,402 | $95,720 | $11,550 | $84,170 |
| 2021 | $1,016 | $95,720 | $11,550 | $84,170 |
| 2020 | $1,016 | $65,980 | $11,550 | $54,430 |
Source: Public Records
Map
Nearby Homes
- 309 1st St SE
- 414 Plymouth St SE
- 603 2nd Ave SE Unit 2
- 10 7th Ave SE
- 107 Crestview Dr
- 811 E Valley Dr
- 901 Central Ave SW
- 570 Loreta Ln
- 419 S Lynn Dr
- 21 Park Village
- 15 Park Village
- 109 Crestview Dr Unit 109
- 1201 2nd St SE
- 610 4th St SW
- 1335 2nd St SE
- 559 Southview Dr SE
- 1335 4th Ave SE Unit 101
- 790 Cedar View Dr Unit 401
- 34645 180th St
- 533 12th Ave SW
Your Personal Tour Guide
Ask me questions while you tour the home.