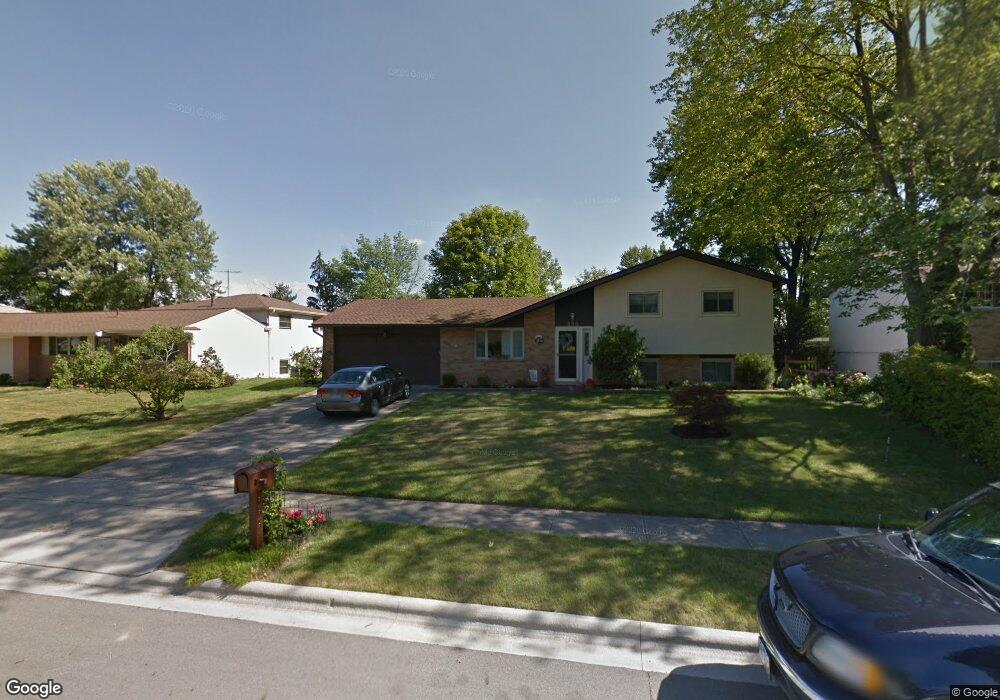
335 Dunbarton Rd Columbus, OH 43230
Gahanna-Havens Corners NeighborhoodEstimated Value: $331,961 - $349,000
3
Beds
2
Baths
1,828
Sq Ft
$185/Sq Ft
Est. Value
About This Home
This home is located at 335 Dunbarton Rd, Columbus, OH 43230 and is currently estimated at $338,240, approximately $185 per square foot. 335 Dunbarton Rd is a home located in Franklin County with nearby schools including Goshen Lane Elementary School, Gahanna West Middle School, and Lincoln High School.
Ownership History
Date
Name
Owned For
Owner Type
Purchase Details
Closed on
Oct 9, 2018
Sold by
Neideffer Jennifer L
Bought by
Neideffer Jesse W
Current Estimated Value
Home Financials for this Owner
Home Financials are based on the most recent Mortgage that was taken out on this home.
Original Mortgage
$139,114
Outstanding Balance
$120,580
Interest Rate
4.6%
Mortgage Type
New Conventional
Estimated Equity
$217,660
Purchase Details
Closed on
Aug 28, 2007
Sold by
Wade Timothy A and Wade Lara M
Bought by
Neideffer Jesse W and Neideffer Jennifer L
Home Financials for this Owner
Home Financials are based on the most recent Mortgage that was taken out on this home.
Original Mortgage
$124,800
Interest Rate
6.71%
Mortgage Type
Purchase Money Mortgage
Purchase Details
Closed on
May 2, 1996
Sold by
Larkin Michael A
Bought by
Timothy A and Wade Lara M
Home Financials for this Owner
Home Financials are based on the most recent Mortgage that was taken out on this home.
Original Mortgage
$110,050
Interest Rate
7.86%
Mortgage Type
VA
Purchase Details
Closed on
Sep 8, 1993
Create a Home Valuation Report for This Property
The Home Valuation Report is an in-depth analysis detailing your home's value as well as a comparison with similar homes in the area
Home Values in the Area
Average Home Value in this Area
Purchase History
| Date | Buyer | Sale Price | Title Company |
|---|---|---|---|
| Neideffer Jesse W | -- | Champion Title & Settlements | |
| Neideffer Jesse W | $156,000 | Trinity Tit | |
| Timothy A | $107,900 | -- | |
| -- | $96,000 | -- |
Source: Public Records
Mortgage History
| Date | Status | Borrower | Loan Amount |
|---|---|---|---|
| Open | Neideffer Jesse W | $139,114 | |
| Closed | Neideffer Jesse W | $124,800 | |
| Closed | Timothy A | $110,050 |
Source: Public Records
Tax History
| Year | Tax Paid | Tax Assessment Tax Assessment Total Assessment is a certain percentage of the fair market value that is determined by local assessors to be the total taxable value of land and additions on the property. | Land | Improvement |
|---|---|---|---|---|
| 2025 | $5,734 | $97,340 | $32,410 | $64,930 |
| 2024 | $5,734 | $97,340 | $32,410 | $64,930 |
| 2023 | $5,662 | $97,335 | $32,410 | $64,925 |
| 2022 | $4,974 | $66,610 | $15,400 | $51,210 |
| 2021 | $4,811 | $66,610 | $15,400 | $51,210 |
| 2020 | $4,771 | $66,610 | $15,400 | $51,210 |
| 2019 | $3,957 | $55,130 | $12,850 | $42,280 |
| 2018 | $3,804 | $55,130 | $12,850 | $42,280 |
| 2017 | $3,654 | $55,130 | $12,850 | $42,280 |
| 2016 | $3,676 | $50,830 | $12,570 | $38,260 |
| 2015 | $3,679 | $50,830 | $12,570 | $38,260 |
| 2014 | $3,651 | $50,830 | $12,570 | $38,260 |
| 2013 | $1,813 | $50,820 | $12,565 | $38,255 |
Source: Public Records
Map
Nearby Homes
- 300 Dunbarton Rd
- 402 Citadel St
- 167 Lansdowne Ave
- 258 Rocky Fork Dr S
- 329 Cliffview Dr
- 3832 Emmons Ave
- 309 Broken Arrow Rd
- 0 E Emmons Ave
- 140 Walnut St
- 2876 Johnstown Rd
- 2225 Mifflin Blvd
- 292 Moorfield Dr
- 0 E Minnesota Ave Unit 224018641
- 169 Flint Ridge Dr
- 0 E Aberdeen Ave Unit 226006710
- 278 Empire Dr
- 3756 Genessee Ave
- 221 Lincolnshire Rd
- 1822 Stelzer Rd
- 206 Lintner St
- 343 Dunbarton Rd
- 327 Dunbarton Rd
- 332 Muskingum Dr
- 340 Muskingum Dr
- 319 Dunbarton Rd
- 349 Dunbarton Rd
- 324 Muskingum Dr
- 332 Dunbarton Rd
- 324 Dunbarton Rd
- 348 Muskingum Dr
- 340 Dunbarton Rd
- 316 Dunbarton Rd
- 357 Dunbarton Rd
- 316 Muskingum Dr
- 311 Dunbarton Rd
- 356 Muskingum Dr
- 348 Dunbarton Rd
- 312 Dunbarton Rd
- 365 Dunbarton Rd
- 306 Muskingum Dr
Your Personal Tour Guide
Ask me questions while you tour the home.