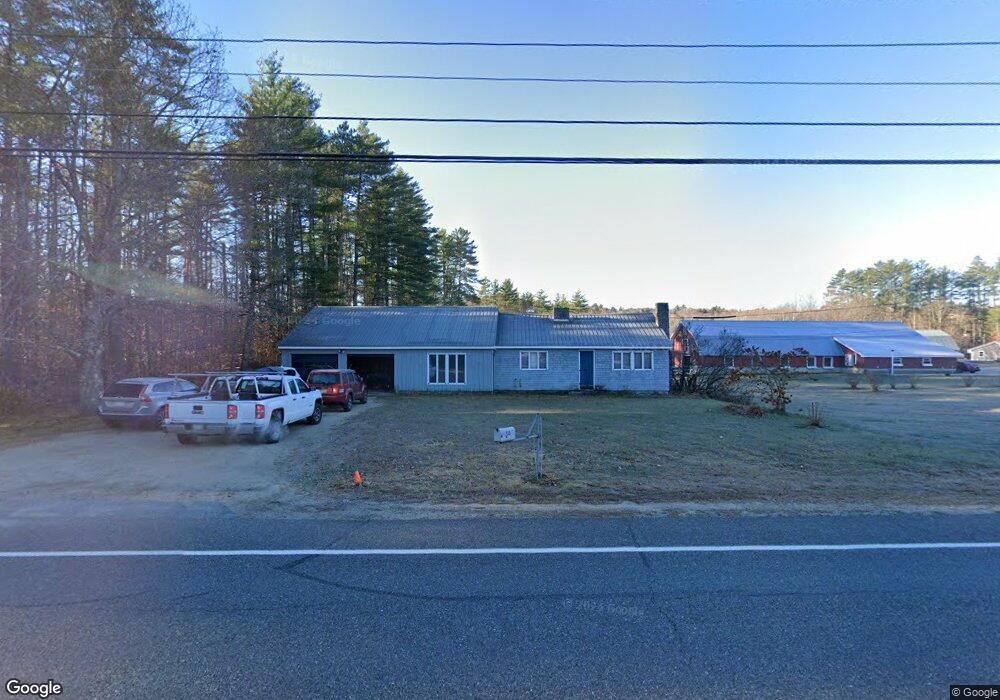
335 Main St Cornish, ME 04020
Studio
1
Bath
792
Sq Ft
72
Acres Lot
About This Home
This home is located at 335 Main St, Cornish, ME 04020. 335 Main St is a home located in York County.
Ownership History
Date
Name
Owned For
Owner Type
Purchase Details
Closed on
Sep 26, 2023
Sold by
Humphrey Wendy S and Humphrey Stephanie J
Bought by
Neyer Meghan C
Purchase Details
Closed on
Jul 31, 2022
Sold by
Humphrey Wendy S and Humphrey Stephanie J
Bought by
Humphrey Annette J
Purchase Details
Closed on
Jul 19, 2019
Sold by
Harolds Way Llc
Bought by
Humphrey Wendy S and Humphrey Stephanie J
Purchase Details
Closed on
Aug 9, 2017
Sold by
Harolds Way Llc
Bought by
Neyer Kevin J and Neyer Daneane
Create a Home Valuation Report for This Property
The Home Valuation Report is an in-depth analysis detailing your home's value as well as a comparison with similar homes in the area
Home Values in the Area
Average Home Value in this Area
Purchase History
We collect this data history from publicly available records. To have your information removed, we recommend requesting removal directly through your county’s website.
| Date | Buyer | Sale Price | Title Company |
|---|---|---|---|
| Neyer Meghan C | -- | None Available | |
| Neyer Meghan C | -- | None Available | |
| Neyer Kayleigh E | -- | None Available | |
| Neyer Kayleigh E | -- | None Available | |
| Neyer Meghan C | -- | None Available | |
| Neyer Kayleigh E | -- | None Available | |
| Humphrey Annette J | $30,000 | None Available | |
| Humphrey Annette J | $30,000 | None Available | |
| Humphrey Richard A | -- | None Available | |
| Humphrey Richard A | -- | None Available | |
| Humphrey Annette J | $30,000 | None Available | |
| Humphrey Richard A | -- | None Available | |
| Humphrey Wendy S | -- | -- | |
| Humphrey Wendy S | -- | -- | |
| Humphrey Wendy S | -- | -- | |
| Neyer Kevin J | -- | -- | |
| Neyer Kevin J | -- | -- | |
| Neyer Kevin J | -- | -- |
Source: Public Records
Tax History
| Year | Tax Paid | Tax Assessment Tax Assessment Total Assessment is a certain percentage of the fair market value that is determined by local assessors to be the total taxable value of land and additions on the property. | Land | Improvement |
|---|---|---|---|---|
| 2025 | $4,546 | $481,100 | $160,600 | $320,500 |
| 2024 | $5,305 | $576,600 | $171,100 | $405,500 |
| 2023 | $4,158 | $290,800 | $130,000 | $160,800 |
| 2022 | $8,023 | $581,400 | $173,800 | $407,600 |
| 2021 | $3,976 | $294,500 | $133,700 | $160,800 |
| 2020 | $4,000 | $298,500 | $137,700 | $160,800 |
| 2019 | $6,652 | $496,400 | $144,600 | $351,800 |
| 2018 | $6,444 | $477,300 | $144,600 | $332,700 |
| 2016 | $4,018 | $311,700 | $150,900 | $160,800 |
| 2015 | $4,021 | $311,700 | $150,900 | $160,800 |
| 2014 | $2,256 | $174,900 | $150,900 | $24,000 |
Source: Public Records
Map
Nearby Homes
- U6-12 Main St
- 120 Cumberland St
- 4 Bridge St
- Lot #11 Jordan Heights Rd
- 22 High Rd
- 20 Main St
- Lot #2 Jordan Heights Rd
- 48 School St
- 96 Maple St
- 110 Maple St
- 198 Senator Black Rd
- TBD Sokokis Trail N
- 500 Pequawket Trail
- 50AC Sawyer Mountain Rd
- 0 Durgintown Rd
- 8 Graffam Rd
- 8 - A Graffam Rd
- 99 July St
- 15 Daylilly Ln
- 106 July St
- 347 Main St
- 330 Main St
- 350 Main St
- 9 Pine Acres Dr
- 9 Pineacres Dr
- 17 Rogers Rd
- 113 Harolds Way
- 9 Rogers Rd
- 4 Pine Acres Dr
- 354 Main St
- 12 Pine Acres Dr
- 50 Harolds Way
- 29 Pine Acres Dr
- 22 Pine Acres Dr
- 302 Main St
- 32 Pine Acres Dr
- 383 Main St
- 116 Saco Woods Dr
- 0001000 Saco Woods
- 0 Wadsworth Rd Unit 1139286
Your Personal Tour Guide
Ask me questions while you tour the home.