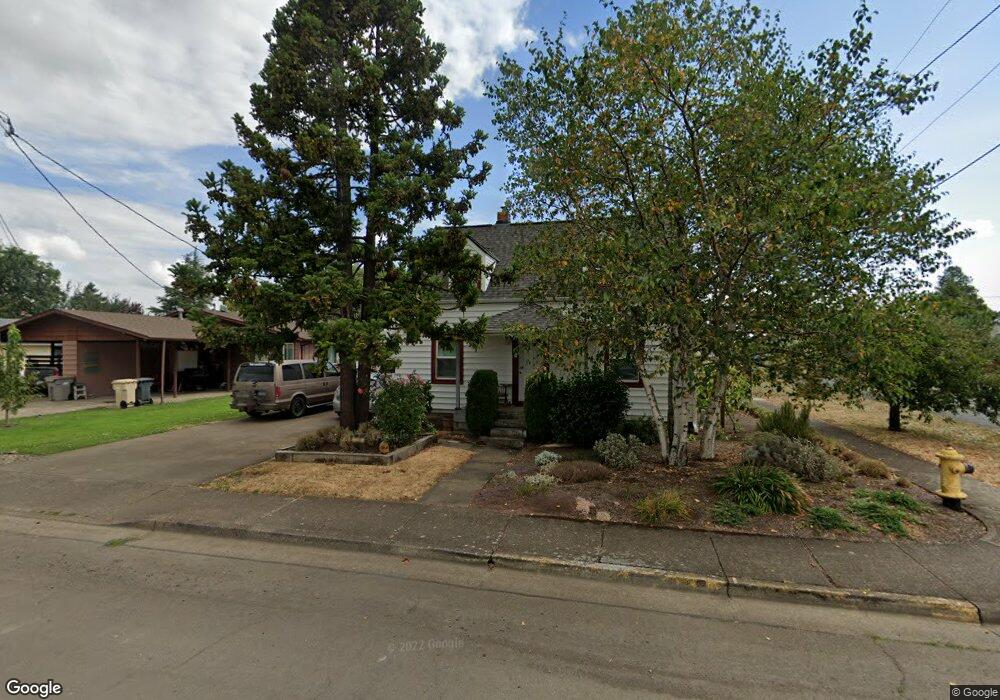
335 S 18th St Philomath, OR 97370
Estimated Value: $382,000 - $468,000
3
Beds
1
Bath
1,523
Sq Ft
$272/Sq Ft
Est. Value
About This Home
This home is located at 335 S 18th St, Philomath, OR 97370 and is currently estimated at $414,222, approximately $271 per square foot. 335 S 18th St is a home located in Benton County with nearby schools including Clemens Primary School, Philomath Elementary School, and Philomath Middle School.
Ownership History
Date
Name
Owned For
Owner Type
Purchase Details
Closed on
Nov 7, 2016
Sold by
Grundyson Tait M
Bought by
Grundyson Tait M and Vesugi Sandra L
Current Estimated Value
Purchase Details
Closed on
Sep 17, 2012
Sold by
Bassett Amy R
Bought by
Grundyson Tait M
Purchase Details
Closed on
Jun 11, 2010
Sold by
Ryan William Dwain and Ryan Melinda Jo
Bought by
Grundyson Tait and Bassett Amy
Home Financials for this Owner
Home Financials are based on the most recent Mortgage that was taken out on this home.
Original Mortgage
$140,000
Interest Rate
5.03%
Mortgage Type
New Conventional
Create a Home Valuation Report for This Property
The Home Valuation Report is an in-depth analysis detailing your home's value as well as a comparison with similar homes in the area
Home Values in the Area
Average Home Value in this Area
Purchase History
| Date | Buyer | Sale Price | Title Company |
|---|---|---|---|
| Grundyson Tait M | -- | None Available | |
| Grundyson Tait M | -- | None Available | |
| Grundyson Tait | $145,500 | First American Title |
Source: Public Records
Mortgage History
| Date | Status | Borrower | Loan Amount |
|---|---|---|---|
| Previous Owner | Grundyson Tait | $140,000 |
Source: Public Records
Tax History Compared to Growth
Tax History
| Year | Tax Paid | Tax Assessment Tax Assessment Total Assessment is a certain percentage of the fair market value that is determined by local assessors to be the total taxable value of land and additions on the property. | Land | Improvement |
|---|---|---|---|---|
| 2025 | $3,764 | $186,189 | -- | -- |
| 2024 | $3,764 | $180,766 | -- | -- |
| 2023 | $3,568 | $175,501 | $0 | $0 |
| 2022 | $3,464 | $170,389 | $0 | $0 |
| 2021 | $3,366 | $165,426 | $0 | $0 |
| 2020 | $3,386 | $160,608 | $0 | $0 |
| 2019 | $3,143 | $155,930 | $0 | $0 |
| 2018 | $3,164 | $151,388 | $0 | $0 |
| 2017 | $3,090 | $146,979 | $0 | $0 |
| 2016 | $2,962 | $142,698 | $0 | $0 |
| 2015 | $2,773 | $138,542 | $0 | $0 |
| 2014 | $2,725 | $134,507 | $0 | $0 |
| 2012 | -- | $126,785 | $0 | $0 |
Source: Public Records
Map
Nearby Homes