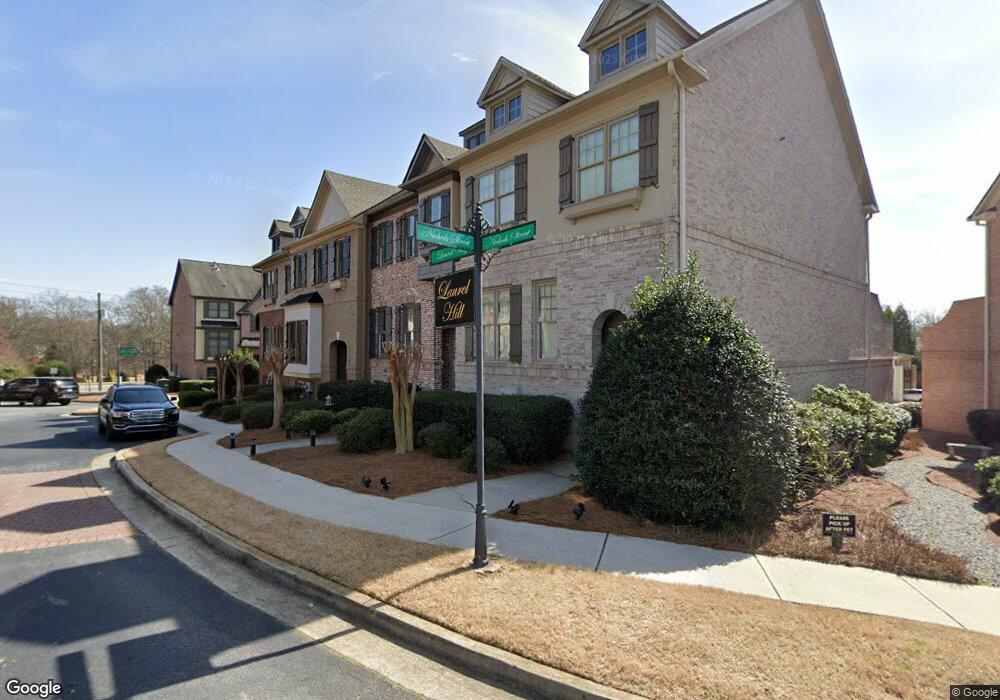
3351 Laurel Way SE Unit 17 Smyrna, GA 30080
Estimated Value: $483,000 - $615,000
3
Beds
4
Baths
2,000
Sq Ft
$262/Sq Ft
Est. Value
About This Home
This home is located at 3351 Laurel Way SE Unit 17, Smyrna, GA 30080 and is currently estimated at $523,500, approximately $261 per square foot. 3351 Laurel Way SE Unit 17 is a home located in Cobb County with nearby schools including Smyrna Elementary School, Campbell Middle School, and Campbell High School.
Ownership History
Date
Name
Owned For
Owner Type
Purchase Details
Closed on
Apr 12, 2022
Sold by
Garvey Rene Aglae
Bought by
3351 Laurel Way Ga Property Llc
Current Estimated Value
Home Financials for this Owner
Home Financials are based on the most recent Mortgage that was taken out on this home.
Original Mortgage
$348,750
Outstanding Balance
$324,997
Interest Rate
3.85%
Mortgage Type
New Conventional
Estimated Equity
$198,504
Purchase Details
Closed on
Mar 15, 2022
Sold by
Mingyang Li
Bought by
Rene Aglae Garvey
Home Financials for this Owner
Home Financials are based on the most recent Mortgage that was taken out on this home.
Original Mortgage
$348,750
Outstanding Balance
$324,997
Interest Rate
3.85%
Mortgage Type
New Conventional
Estimated Equity
$198,504
Purchase Details
Closed on
Apr 27, 2018
Sold by
Mingyang Li
Bought by
Mingyang Li and Luan Yulin
Home Financials for this Owner
Home Financials are based on the most recent Mortgage that was taken out on this home.
Original Mortgage
$230,000
Interest Rate
4.44%
Mortgage Type
New Conventional
Purchase Details
Closed on
Aug 26, 2005
Sold by
Laurel Hill Llc
Bought by
Knight Dorothy D
Home Financials for this Owner
Home Financials are based on the most recent Mortgage that was taken out on this home.
Original Mortgage
$161,000
Interest Rate
5.86%
Mortgage Type
New Conventional
Create a Home Valuation Report for This Property
The Home Valuation Report is an in-depth analysis detailing your home's value as well as a comparison with similar homes in the area
Home Values in the Area
Average Home Value in this Area
Purchase History
| Date | Buyer | Sale Price | Title Company |
|---|---|---|---|
| 3351 Laurel Way Ga Property Llc | -- | None Listed On Document | |
| Rene Aglae Garvey | $465,000 | None Listed On Document | |
| Mingyang Li | -- | -- | |
| Mingyang Li | $330,000 | -- | |
| Knight Dorothy D | $322,900 | -- |
Source: Public Records
Mortgage History
| Date | Status | Borrower | Loan Amount |
|---|---|---|---|
| Open | Rene Aglae Garvey | $348,750 | |
| Previous Owner | Mingyang Li | $230,000 | |
| Previous Owner | Knight Dorothy D | $161,000 |
Source: Public Records
Tax History Compared to Growth
Tax History
| Year | Tax Paid | Tax Assessment Tax Assessment Total Assessment is a certain percentage of the fair market value that is determined by local assessors to be the total taxable value of land and additions on the property. | Land | Improvement |
|---|---|---|---|---|
| 2025 | $4,851 | $178,620 | $40,000 | $138,620 |
| 2024 | $4,763 | $175,376 | $34,000 | $141,376 |
| 2023 | $4,763 | $175,376 | $34,000 | $141,376 |
| 2022 | $3,730 | $158,644 | $34,000 | $124,644 |
| 2021 | $3,186 | $129,004 | $34,000 | $95,004 |
| 2020 | $3,186 | $129,004 | $34,000 | $95,004 |
| 2019 | $3,186 | $129,004 | $34,000 | $95,004 |
| 2018 | $936 | $118,772 | $34,000 | $84,772 |
| 2017 | $646 | $103,532 | $14,000 | $89,532 |
| 2016 | $647 | $103,532 | $14,000 | $89,532 |
| 2015 | $529 | $79,996 | $14,000 | $65,996 |
| 2014 | $547 | $79,996 | $0 | $0 |
Source: Public Records
Map
Nearby Homes
- 3351 Laurel Way SE
- 3355 Laurel Way SE
- 3353 Laurel Way SE
- 3355 Laurel Way SE
- 3353 Laurel Way SE
- 3353 Laurel Way SE Unit 3113
- 3353 Laurel Way SE Unit 3353
- 3355 Laurel Way SE
- 3357 Laurel Way SE
- 3097 Nichols St SE
- 3091 Nichols St SE Unit 16
- 3091 Nichols St SE Unit 16
- 3093 Nichols St SE
- 3095 Nichols St
- 3358 Laurel Way Unit 3358
- 3364 Laurel Way SE Unit 1217
- 3358 Laurel Way
- 3364 Laurel Way SE
- 3362 Laurel Way SE Unit 3362
- 3362 Laurel Way SE