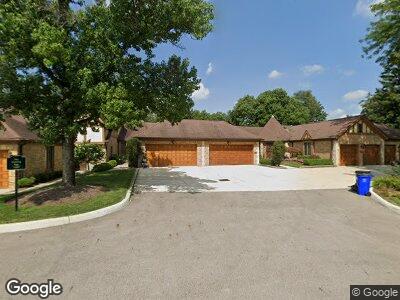
3355 Mansion Way Unit B3 Columbus, OH 43221
Estimated Value: $403,000 - $494,000
2
Beds
2
Baths
1,605
Sq Ft
$271/Sq Ft
Est. Value
About This Home
This home is located at 3355 Mansion Way Unit B3, Columbus, OH 43221 and is currently estimated at $434,371, approximately $270 per square foot. 3355 Mansion Way Unit B3 is a home located in Franklin County with nearby schools including Greensview Elementary School, Hastings Middle School, and Upper Arlington High School.
Ownership History
Date
Name
Owned For
Owner Type
Purchase Details
Closed on
Dec 22, 2023
Sold by
Johnson Jeffrey S
Bought by
Johnson Robert Jeffrey
Current Estimated Value
Purchase Details
Closed on
Oct 21, 2020
Sold by
Johnson Deborah D
Bought by
Johnson Jeffrey S
Purchase Details
Closed on
May 17, 2007
Sold by
Carnes Debbie J and Carnes Allen D
Bought by
Johnston Deborah D
Home Financials for this Owner
Home Financials are based on the most recent Mortgage that was taken out on this home.
Original Mortgage
$189,600
Interest Rate
6.26%
Mortgage Type
Unknown
Purchase Details
Closed on
Oct 3, 2005
Sold by
James Clarence R and James June E
Bought by
Carnes Debbie J
Purchase Details
Closed on
Oct 27, 1995
Sold by
Allen Edward H
Bought by
James Clarence R and James June
Purchase Details
Closed on
Nov 1, 1983
Create a Home Valuation Report for This Property
The Home Valuation Report is an in-depth analysis detailing your home's value as well as a comparison with similar homes in the area
Home Values in the Area
Average Home Value in this Area
Purchase History
| Date | Buyer | Sale Price | Title Company |
|---|---|---|---|
| Johnson Robert Jeffrey | -- | None Listed On Document | |
| Johnson Jeffrey S | -- | None Available | |
| Johnston Deborah D | $237,000 | Talon Group | |
| Carnes Debbie J | $215,000 | Talon Group | |
| James Clarence R | $165,000 | -- | |
| -- | -- | -- |
Source: Public Records
Mortgage History
| Date | Status | Borrower | Loan Amount |
|---|---|---|---|
| Previous Owner | Johnson Deborah D | $189,600 |
Source: Public Records
Tax History Compared to Growth
Tax History
| Year | Tax Paid | Tax Assessment Tax Assessment Total Assessment is a certain percentage of the fair market value that is determined by local assessors to be the total taxable value of land and additions on the property. | Land | Improvement |
|---|---|---|---|---|
| 2024 | $10,922 | $138,080 | $28,000 | $110,080 |
| 2023 | $8,049 | $138,080 | $28,000 | $110,080 |
| 2022 | $8,211 | $95,900 | $17,500 | $78,400 |
| 2021 | $6,067 | $95,900 | $17,500 | $78,400 |
| 2020 | $6,014 | $95,900 | $17,500 | $78,400 |
| 2019 | $5,443 | $76,720 | $14,000 | $62,720 |
| 2018 | $5,054 | $76,720 | $14,000 | $62,720 |
| 2017 | $5,403 | $76,720 | $14,000 | $62,720 |
| 2016 | $4,699 | $69,200 | $17,290 | $51,910 |
| 2015 | $4,695 | $69,200 | $17,290 | $51,910 |
| 2014 | $4,700 | $69,200 | $17,290 | $51,910 |
| 2013 | $2,599 | $72,835 | $18,200 | $54,635 |
Source: Public Records
Map
Nearby Homes
- 1121 Afton Rd
- 1069 Caniff Rd
- 1345 Fishinger Rd
- 1324 Fountaine Dr Unit B1U
- 1026 Bricker Blvd
- 3526 Rue de Fleur Unit B18U
- 3545 Shattuck Ave
- 958 Bricker Blvd
- 1119 Stanhope Dr
- 966 Manor Ln Unit A
- 3823 Beecham Ct
- 923 Kenwood Ln
- 751 Latham Ct
- 1763-1769 Ardleigh Rd Unit 1763-1769
- 1827 Lynnhaven Dr
- 3012 Oldham Rd
- 3417 Leighton Rd
- 3588 Reed Rd Unit 4
- 1841 Inchcliff Rd
- 3600 Reed Rd Unit 16
- 3355 Mansion Way Unit B3
- 3343 Mansion Way Unit B9
- 3353 Mansion Way Unit B4
- 3353 Mansion Way Unit 4
- 3357 Mansion Way Unit B2
- 3359 Mansion Way Unit B1
- 3359 Mansion Way Unit 1
- 3351 Mansion Way
- 3351 Mansion Way Unit 5
- 3349 Mansion Way
- 3349 Mansion Way Unit 6
- 3347 Mansion Way
- 3345 Mansion Way Unit B8
- 3336 Westbury Dr
- 3324 Westbury Dr
- 3348 Westbury Dr
- 3341 Mansion Way
- 3348 Mansion Way
- 1209 London Dr
- 1221 London Dr