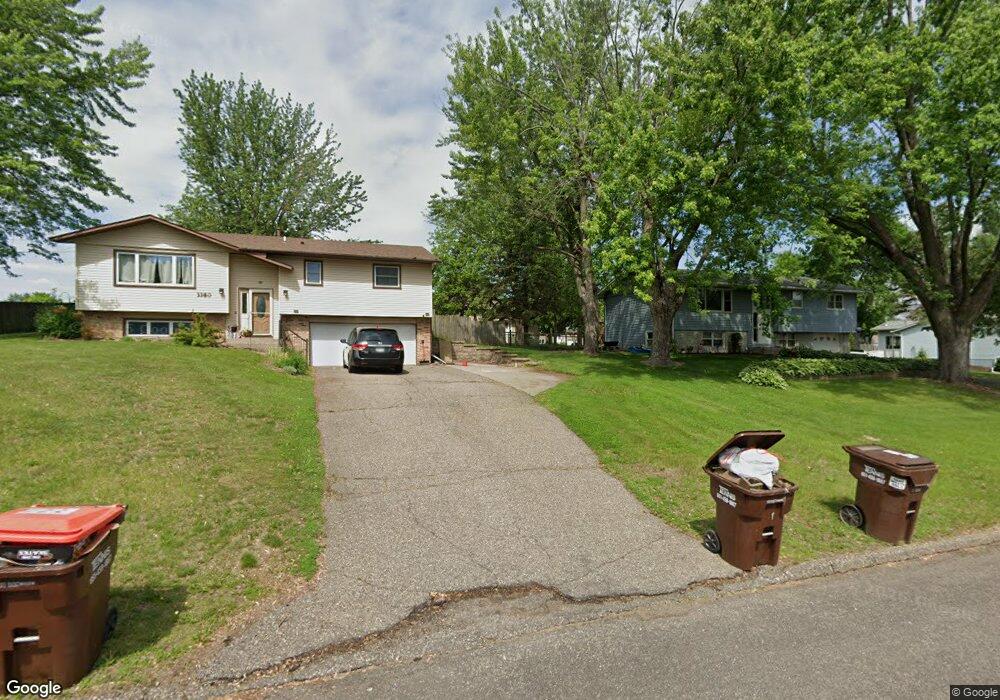
3357 Cory Ln Hastings, MN 55033
Hastings-Marshan Township NeighborhoodEstimated Value: $242,000 - $270,020
3
Beds
2
Baths
1,096
Sq Ft
$236/Sq Ft
Est. Value
About This Home
This home is located at 3357 Cory Ln, Hastings, MN 55033 and is currently estimated at $259,005, approximately $236 per square foot. 3357 Cory Ln is a home located in Dakota County with nearby schools including Kennedy Elementary School, Hastings Middle School, and Hastings High School.
Ownership History
Date
Name
Owned For
Owner Type
Purchase Details
Closed on
Jul 26, 2024
Sold by
Weilandt Karl D and Weilandt Shannon D
Bought by
Karl And Shannon Weilandt Living Trust and Weilandt
Current Estimated Value
Purchase Details
Closed on
Sep 26, 2018
Sold by
Roth Randall L
Bought by
Weilandt Karl D and Weilandt Shannon D
Home Financials for this Owner
Home Financials are based on the most recent Mortgage that was taken out on this home.
Original Mortgage
$130,000
Interest Rate
4.5%
Mortgage Type
New Conventional
Purchase Details
Closed on
Aug 26, 2003
Sold by
Randolph Mark and Randolph Natasha L
Bought by
Roth Randall L
Purchase Details
Closed on
Jun 27, 2002
Sold by
Holloway Van William and Holloway Brenda L
Bought by
Randolph Mark and Randolph Natasha C
Purchase Details
Closed on
May 25, 2001
Sold by
Dakota Realty Co
Bought by
Holloway William
Purchase Details
Closed on
May 25, 1999
Sold by
Hcc Of Hastings Inc
Bought by
Holloway William
Create a Home Valuation Report for This Property
The Home Valuation Report is an in-depth analysis detailing your home's value as well as a comparison with similar homes in the area
Home Values in the Area
Average Home Value in this Area
Purchase History
| Date | Buyer | Sale Price | Title Company |
|---|---|---|---|
| Karl And Shannon Weilandt Living Trust | $500 | None Listed On Document | |
| Weilandt Karl D | $174,000 | Burnet Title | |
| Roth Randall L | $165,000 | -- | |
| Randolph Mark | $140,000 | -- | |
| Holloway William | $98,000 | -- | |
| Holloway William | $99,500 | -- |
Source: Public Records
Mortgage History
| Date | Status | Borrower | Loan Amount |
|---|---|---|---|
| Previous Owner | Weilandt Karl D | $130,000 | |
| Closed | Holloway William | -- |
Source: Public Records
Tax History Compared to Growth
Tax History
| Year | Tax Paid | Tax Assessment Tax Assessment Total Assessment is a certain percentage of the fair market value that is determined by local assessors to be the total taxable value of land and additions on the property. | Land | Improvement |
|---|---|---|---|---|
| 2024 | $2,626 | $233,100 | $35,600 | $197,500 |
| 2023 | $2,626 | $227,400 | $35,400 | $192,000 |
| 2022 | $2,316 | $213,700 | $35,300 | $178,400 |
| 2021 | $2,214 | $188,100 | $30,700 | $157,400 |
| 2020 | $2,176 | $178,500 | $29,300 | $149,200 |
| 2019 | $1,859 | $169,600 | $27,900 | $141,700 |
| 2018 | $1,767 | $156,100 | $26,500 | $129,600 |
| 2017 | $1,532 | $145,600 | $25,300 | $120,300 |
| 2016 | $1,486 | $129,900 | $23,600 | $106,300 |
| 2015 | $1,260 | $98,247 | $17,942 | $80,305 |
| 2014 | -- | $82,878 | $16,320 | $66,558 |
| 2013 | -- | $67,291 | $13,402 | $53,889 |
Source: Public Records
Map
Nearby Homes
- 3200 Malcolm Ave
- 3525 Douglas Dr
- 3560 Malcolm Ave
- 217 Tiffany Dr
- 235 Tiffany Dr
- 182 Sandpiper Cir
- 3525 Vermillion St
- 3575 Vermillion St
- 2211 Glacier Way
- 131 24th St W
- 313 Frederick Cir Unit 106
- 2341 Glacier Way
- 545 Tuttle Dr
- 115 Kinglet Dr
- 379 Frederick Cir Unit 905
- 456 Hayes Dr Unit 59
- 2473 Yellowstone Dr
- 4198 Starling Dr
- 2422 Rushmore Rd
- 2452 Rushmore Rd