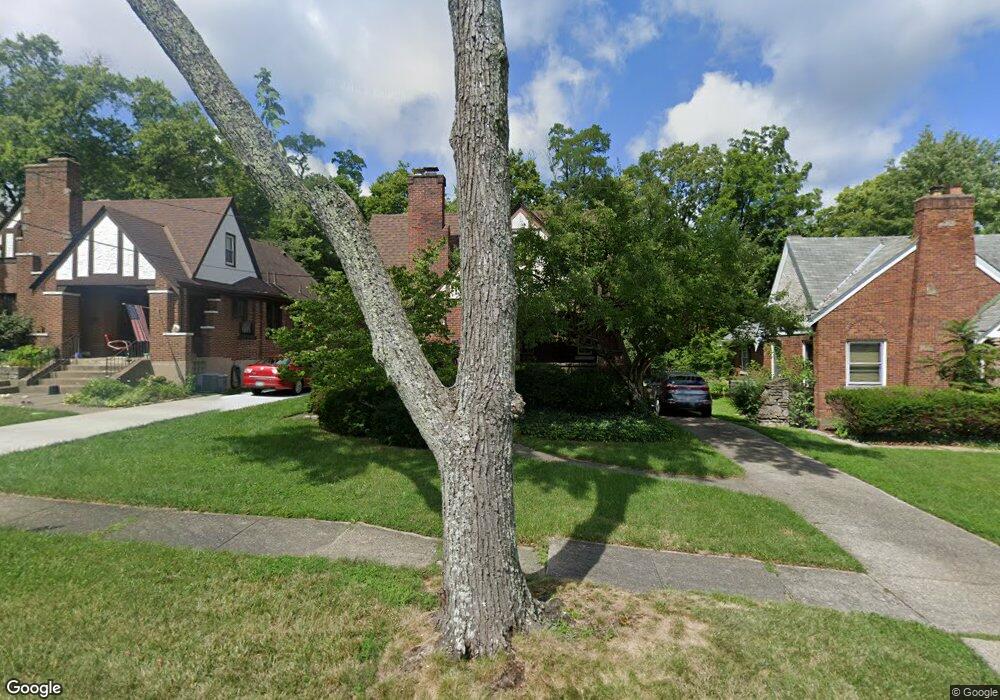
3357 Meyer Place Cincinnati, OH 45211
Westwood NeighborhoodEstimated Value: $209,000 - $241,000
3
Beds
1
Bath
1,782
Sq Ft
$125/Sq Ft
Est. Value
About This Home
This home is located at 3357 Meyer Place, Cincinnati, OH 45211 and is currently estimated at $222,910, approximately $125 per square foot. 3357 Meyer Place is a home located in Hamilton County with nearby schools including Western Hills High School, Gilbert A. Dater High School, and Robert A. Taft Information Technology High School.
Ownership History
Date
Name
Owned For
Owner Type
Purchase Details
Closed on
Oct 16, 2018
Sold by
Meiners Elizabeth A
Bought by
Meiners Eli C
Current Estimated Value
Purchase Details
Closed on
Mar 15, 2007
Sold by
Hopkins Darren H and Hopkins Suzanne R
Bought by
Meiners Eli C and Meiners Elizabeth A
Home Financials for this Owner
Home Financials are based on the most recent Mortgage that was taken out on this home.
Original Mortgage
$104,000
Outstanding Balance
$61,724
Interest Rate
6.27%
Mortgage Type
Unknown
Estimated Equity
$161,186
Purchase Details
Closed on
Feb 17, 1995
Sold by
Widder Carey D and Widder Patricia L
Bought by
Hopkins Darren H and Hopkins Suzanne R
Home Financials for this Owner
Home Financials are based on the most recent Mortgage that was taken out on this home.
Original Mortgage
$77,301
Interest Rate
9.21%
Mortgage Type
FHA
Create a Home Valuation Report for This Property
The Home Valuation Report is an in-depth analysis detailing your home's value as well as a comparison with similar homes in the area
Home Values in the Area
Average Home Value in this Area
Purchase History
We collect this data history from publicly available records. To have your information removed, we recommend requesting removal directly through your county’s website.
| Date | Buyer | Sale Price | Title Company |
|---|---|---|---|
| Meiners Eli C | -- | None Available | |
| Meiners Eli C | $104,000 | Attorney | |
| Hopkins Darren H | -- | -- |
Source: Public Records
Mortgage History
We collect this data history from publicly available records. To have your information removed, we recommend requesting removal directly through your county’s website.
| Date | Status | Borrower | Loan Amount |
|---|---|---|---|
| Open | Meiners Eli C | $104,000 | |
| Previous Owner | Hopkins Darren H | $77,301 |
Source: Public Records
Tax History
| Year | Tax Paid | Tax Assessment Tax Assessment Total Assessment is a certain percentage of the fair market value that is determined by local assessors to be the total taxable value of land and additions on the property. | Land | Improvement |
|---|---|---|---|---|
| 2025 | $3,060 | $49,543 | $7,130 | $42,413 |
| 2024 | $2,967 | $49,543 | $7,130 | $42,413 |
| 2023 | $3,034 | $49,543 | $7,130 | $42,413 |
| 2022 | $1,392 | $20,265 | $5,789 | $14,476 |
| 2021 | $1,337 | $20,265 | $5,789 | $14,476 |
| 2020 | $1,376 | $20,265 | $5,789 | $14,476 |
| 2019 | $1,366 | $18,424 | $5,264 | $13,160 |
| 2018 | $1,369 | $18,424 | $5,264 | $13,160 |
| 2017 | $1,300 | $18,424 | $5,264 | $13,160 |
| 2016 | $1,630 | $22,824 | $6,111 | $16,713 |
| 2015 | $1,471 | $22,824 | $6,111 | $16,713 |
| 2014 | $1,481 | $22,824 | $6,111 | $16,713 |
| 2013 | $1,569 | $23,776 | $6,367 | $17,409 |
Source: Public Records
Map
Nearby Homes
- 2886 Shaffer Ave
- 2687 Westwood Northern Blvd
- 2945 Mignon Ave
- 3413 Millrich Ave
- 2738 Montana Ave
- 2859 Harrison Ave
- 2814 Harrison Ave
- 3518 Hazelwood Ave
- 2580 Westwood Northern Blvd
- 2868 Dirheim Ave
- 3401 Ferncroft Dr
- 2693 Montana Ave
- 3143 Bracken Woods Ln
- 3127 Bracken Woods Ln
- 3111 Bracken Woods Ln
- 3017 Montana Ave
- 2753 Werkastle Ln
- 2654 Ocosta Ave
- 3116 Gobel Ave
- 2635 Ocosta Ave
- 3353 Meyer Place
- 3349 Meyer Place
- 3361 Meyer Place
- 3341 Meyer Place
- 3365 Meyer Place
- 3350 Wunder Ave
- 3346 Wunder Ave
- 3354 Wunder Ave
- 3342 Wunder Ave
- 3352 Meyer Place
- 3337 Meyer Place
- 3340 Wunder Ave
- 3348 Meyer Place
- 3356 Meyer Place
- 3360 Meyer Place
- 3344 Meyer Place
- 3362 Wunder Ave
- 3334 Wunder Ave
- 3333 Meyer Place
- 3364 Meyer Place
Your Personal Tour Guide
Ask me questions while you tour the home.