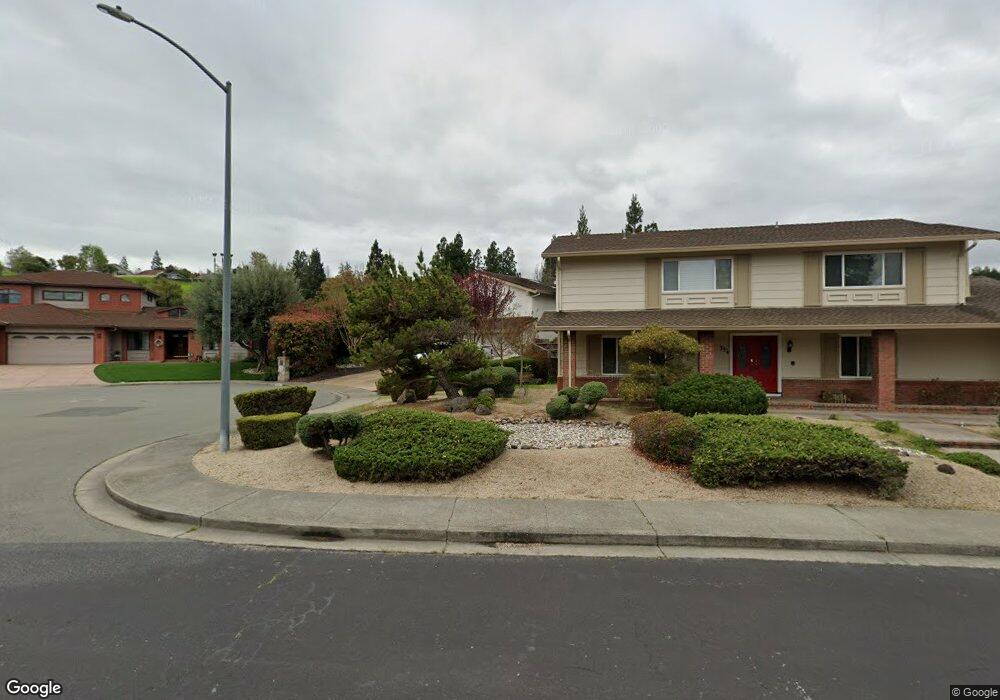
336 Andora Ln San Ramon, CA 94583
Twin Creeks NeighborhoodEstimated Value: $1,752,000 - $1,904,000
4
Beds
3
Baths
2,586
Sq Ft
$709/Sq Ft
Est. Value
About This Home
This home is located at 336 Andora Ln, San Ramon, CA 94583 and is currently estimated at $1,833,272, approximately $708 per square foot. 336 Andora Ln is a home located in Contra Costa County with nearby schools including Bollinger Canyon Elementary School, Iron Horse Middle School, and California High School.
Ownership History
Date
Name
Owned For
Owner Type
Purchase Details
Closed on
Jul 6, 2015
Sold by
Rennicks Scott S
Bought by
Rennicks Scott S
Current Estimated Value
Home Financials for this Owner
Home Financials are based on the most recent Mortgage that was taken out on this home.
Original Mortgage
$605,000
Interest Rate
3.83%
Mortgage Type
New Conventional
Purchase Details
Closed on
Dec 29, 2010
Sold by
Rennicks Scott S
Bought by
Rennicks Scott S
Purchase Details
Closed on
Oct 21, 1998
Sold by
Rennicks Bunny B
Bought by
Rennicks Scott S
Home Financials for this Owner
Home Financials are based on the most recent Mortgage that was taken out on this home.
Original Mortgage
$152,150
Interest Rate
6.6%
Mortgage Type
Purchase Money Mortgage
Create a Home Valuation Report for This Property
The Home Valuation Report is an in-depth analysis detailing your home's value as well as a comparison with similar homes in the area
Home Values in the Area
Average Home Value in this Area
Purchase History
| Date | Buyer | Sale Price | Title Company |
|---|---|---|---|
| Rennicks Scott S | -- | Wfg Lender Services | |
| Rennicks Scott S | -- | Wfg Lender Services | |
| Rennicks Scott S | -- | None Available | |
| Rennicks Scott S | -- | North American Title Co |
Source: Public Records
Mortgage History
| Date | Status | Borrower | Loan Amount |
|---|---|---|---|
| Closed | Rennicks Scott S | $605,000 | |
| Closed | Rennicks Scott S | $152,150 |
Source: Public Records
Tax History Compared to Growth
Tax History
| Year | Tax Paid | Tax Assessment Tax Assessment Total Assessment is a certain percentage of the fair market value that is determined by local assessors to be the total taxable value of land and additions on the property. | Land | Improvement |
|---|---|---|---|---|
| 2025 | $5,338 | $412,055 | $116,207 | $295,848 |
| 2024 | $5,240 | $403,977 | $113,929 | $290,048 |
| 2023 | $5,240 | $396,057 | $111,696 | $284,361 |
| 2022 | $5,199 | $388,292 | $109,506 | $278,786 |
| 2021 | $5,080 | $380,679 | $107,359 | $273,320 |
| 2019 | $4,944 | $369,390 | $104,176 | $265,214 |
| 2018 | $4,760 | $362,148 | $102,134 | $260,014 |
| 2017 | $4,581 | $355,048 | $100,132 | $254,916 |
| 2016 | $4,504 | $348,087 | $98,169 | $249,918 |
| 2015 | $4,431 | $342,859 | $96,695 | $246,164 |
| 2014 | $4,355 | $336,143 | $94,801 | $241,342 |
Source: Public Records
Map
Nearby Homes
- 2632 Campeche Ct
- 600 Guaymas Ct
- 2720 Marsh Dr
- 3104 Sombrero Cir
- Plan 3 at City Village - The Towns
- Plan 3 at City Village - The Rows
- Plan 1X at City Village - The Courts
- Plan 2 at City Village - The Towns
- Plan 3X at City Village - The Courts
- Plan 1 at City Village - The Rows
- Plan 1 at City Village - The Towns
- Plan 3 at City Village - The Courts
- Plan 2 at City Village - The Rows
- Plan 2 at City Village - The Courts
- Plan 1 at City Village - The Courts
- Plan 4 at City Village - The Towns
- 2740 Mohawk Cir
- 334 La Paz Ct
- 732 Fountainhead Ct
- 560 La Copita Ct