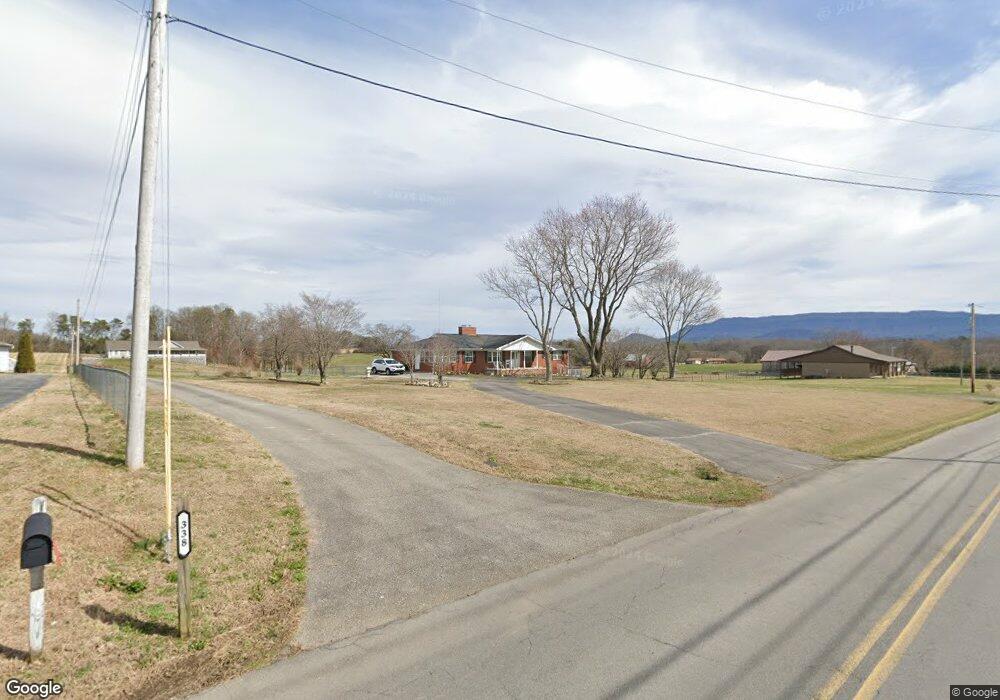
336 Keener Rd Seymour, TN 37865
Estimated Value: $302,000 - $574,000
--
Bed
3
Baths
2,226
Sq Ft
$210/Sq Ft
Est. Value
About This Home
This home is located at 336 Keener Rd, Seymour, TN 37865 and is currently estimated at $466,996, approximately $209 per square foot. 336 Keener Rd is a home located in Blount County with nearby schools including Prospect Elementary School, Heritage Middle School, and Heritage High School.
Ownership History
Date
Name
Owned For
Owner Type
Purchase Details
Closed on
Feb 23, 2021
Sold by
Thompson Elizabeth Mary
Bought by
Roberts Bobby D
Current Estimated Value
Home Financials for this Owner
Home Financials are based on the most recent Mortgage that was taken out on this home.
Original Mortgage
$201,450
Outstanding Balance
$180,175
Interest Rate
2.7%
Mortgage Type
VA
Estimated Equity
$286,821
Purchase Details
Closed on
Dec 8, 2020
Sold by
Scott Velma Mae Estate
Bought by
Thompson Elizabeth Mary
Purchase Details
Closed on
Sep 17, 2014
Sold by
Drinnon Velma Mae
Bought by
Scott Velma Mae
Purchase Details
Closed on
Mar 10, 2005
Sold by
Velma Drinnon M
Bought by
Roberts Helen
Purchase Details
Closed on
Dec 20, 2004
Sold by
Jeffrey Roberts L
Bought by
Drinnon Velma Mae
Purchase Details
Closed on
Dec 17, 2004
Bought by
Drinnon Velma Mae
Purchase Details
Closed on
Jun 7, 2001
Sold by
Jones Frances
Bought by
Roberts Jeffrey
Home Financials for this Owner
Home Financials are based on the most recent Mortgage that was taken out on this home.
Original Mortgage
$120,785
Interest Rate
6.64%
Purchase Details
Closed on
Jan 1, 1986
Bought by
Jones Frances Margaret
Create a Home Valuation Report for This Property
The Home Valuation Report is an in-depth analysis detailing your home's value as well as a comparison with similar homes in the area
Home Values in the Area
Average Home Value in this Area
Purchase History
| Date | Buyer | Sale Price | Title Company |
|---|---|---|---|
| Roberts Bobby D | $201,450 | -- | |
| Roberts Bobby D | $201,450 | New Title Company Name | |
| Thompson Elizabeth Mary | $185,552 | -- | |
| Scott Velma Mae | -- | -- | |
| Roberts Helen | $56,000 | -- | |
| Drinnon Velma Mae | $220,000 | -- | |
| Drinnon Velma Mae | $220,000 | -- | |
| Roberts Jeffrey | $125,000 | -- | |
| Jones Frances Margaret | $56,000 | -- |
Source: Public Records
Mortgage History
| Date | Status | Borrower | Loan Amount |
|---|---|---|---|
| Open | Roberts Bobby D | $201,450 | |
| Closed | Roberts Bobby D | $201,450 | |
| Previous Owner | Jones Frances Margaret | $120,785 |
Source: Public Records
Tax History Compared to Growth
Tax History
| Year | Tax Paid | Tax Assessment Tax Assessment Total Assessment is a certain percentage of the fair market value that is determined by local assessors to be the total taxable value of land and additions on the property. | Land | Improvement |
|---|---|---|---|---|
| 2024 | $1,648 | $103,675 | $24,725 | $78,950 |
| 2023 | $1,648 | $103,675 | $24,725 | $78,950 |
| 2022 | $1,530 | $61,925 | $17,300 | $44,625 |
| 2021 | $1,530 | $61,925 | $17,300 | $44,625 |
| 2020 | $1,530 | $61,925 | $17,300 | $44,625 |
| 2019 | $1,530 | $61,925 | $17,300 | $44,625 |
| 2018 | $1,400 | $56,700 | $16,350 | $40,350 |
| 2017 | $1,400 | $56,700 | $16,350 | $40,350 |
| 2016 | $1,400 | $56,700 | $16,350 | $40,350 |
| 2015 | $1,219 | $56,700 | $16,350 | $40,350 |
| 2014 | $1,212 | $56,700 | $16,350 | $40,350 |
| 2013 | $1,212 | $56,350 | $0 | $0 |
Source: Public Records
Map
Nearby Homes
- 5925 Sevierville Rd
- 1506 Cunningham Rd W
- 1480 Cunningham Rd W
- 237 Westmoreland Ct
- 325 Blue Ridge Ln
- 205 Blue Ridge Ln
- 116 Blue Ridge Ln
- 1040 Pathways Dr
- 1527 Brahman Ln
- 1019 Pathways Dr
- 706 Paso Trail Way
- 521 Devon St
- Hanover Plan at Sharps Glen
- Salem Plan at Sharps Glen
- Denton Plan at Sharps Glen
- Madison Plan at Sharps Glen
- Cali Plan at Sharps Glen
- Hayden Plan at Sharps Glen
- Fairview Plan at Sharps Glen
- Richland Plan at Sharps Glen
- 320 Keener Rd
- 342 Keener Rd
- 308 Keener Rd
- 312 Keener Rd
- 333 Keener Rd
- 348 Keener Rd
- 338 Keener Rd
- 286 Keener Rd
- 356 Keener Rd
- 360 Keener Rd
- 305 Keener Rd
- 364 Keener Rd
- 278 Keener Rd
- 368 Keener Rd
- 272 Keener Rd
- 1128 Tittsworth Springs Rd
- 266 Keener Rd
- 1102 Tittsworth Springs Rd
- 281 Keener Rd
- 1118 Tittsworth Springs Rd