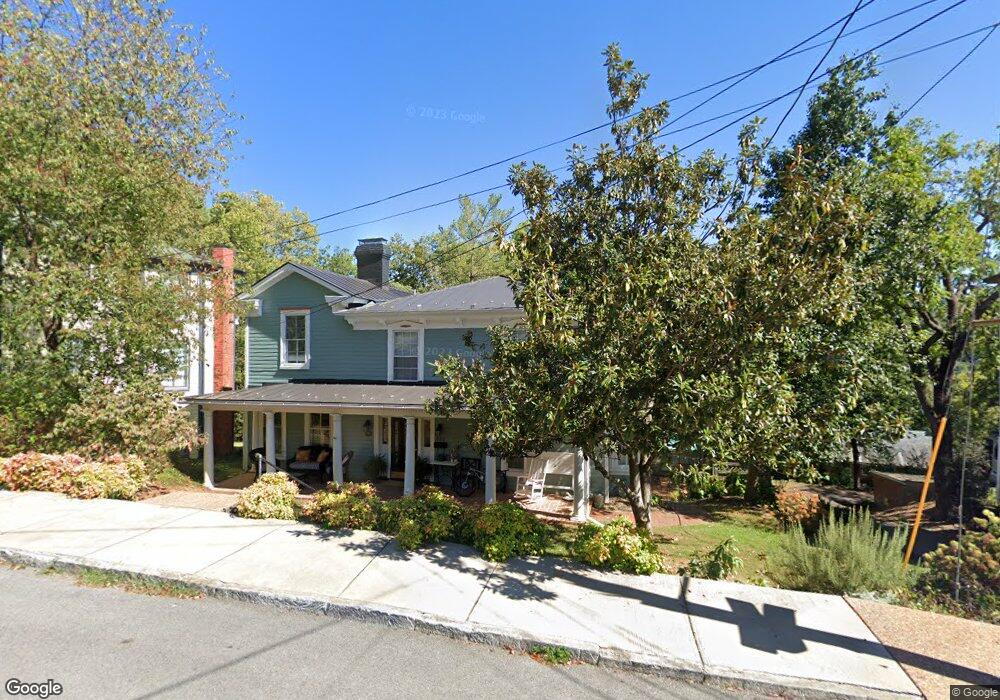
336 Vine St Staunton, VA 24401
Estimated Value: $501,039 - $709,000
3
Beds
4
Baths
3,181
Sq Ft
$195/Sq Ft
Est. Value
About This Home
This home is located at 336 Vine St, Staunton, VA 24401 and is currently estimated at $620,760, approximately $195 per square foot. 336 Vine St is a home located in Staunton City with nearby schools including Thomas C. McSwain Elementary School, Shelburne Middle School, and Staunton High School.
Ownership History
Date
Name
Owned For
Owner Type
Purchase Details
Closed on
Jun 12, 2018
Sold by
Sutton Christopher David and Sutton Heather M
Bought by
Cundy Steven P and Cundy Ann W
Current Estimated Value
Home Financials for this Owner
Home Financials are based on the most recent Mortgage that was taken out on this home.
Original Mortgage
$280,000
Outstanding Balance
$242,153
Interest Rate
4.5%
Mortgage Type
New Conventional
Estimated Equity
$378,607
Purchase Details
Closed on
Aug 13, 2012
Sold by
Gilliland William M and Gilliland Lynn T
Bought by
Sutton Christopher David and Sutton Heather M
Home Financials for this Owner
Home Financials are based on the most recent Mortgage that was taken out on this home.
Original Mortgage
$23,265
Interest Rate
3.56%
Mortgage Type
Credit Line Revolving
Create a Home Valuation Report for This Property
The Home Valuation Report is an in-depth analysis detailing your home's value as well as a comparison with similar homes in the area
Home Values in the Area
Average Home Value in this Area
Purchase History
| Date | Buyer | Sale Price | Title Company |
|---|---|---|---|
| Cundy Steven P | $350,000 | Bankers Title Shenandoah | |
| Sutton Christopher David | $235,000 | None Available |
Source: Public Records
Mortgage History
| Date | Status | Borrower | Loan Amount |
|---|---|---|---|
| Open | Cundy Steven P | $280,000 | |
| Previous Owner | Sutton Christopher David | $23,265 | |
| Previous Owner | Sutton Christopher David | $188,000 |
Source: Public Records
Tax History Compared to Growth
Tax History
| Year | Tax Paid | Tax Assessment Tax Assessment Total Assessment is a certain percentage of the fair market value that is determined by local assessors to be the total taxable value of land and additions on the property. | Land | Improvement |
|---|---|---|---|---|
| 2025 | $4,484 | $492,800 | $47,900 | $444,900 |
| 2024 | $3,738 | $419,950 | $40,650 | $379,300 |
| 2023 | $3,738 | $419,950 | $40,650 | $379,300 |
| 2022 | $3,038 | $330,210 | $29,410 | $300,800 |
| 2021 | $3,038 | $330,210 | $29,410 | $300,800 |
| 2020 | $2,970 | $312,610 | $29,410 | $283,200 |
| 2019 | $2,970 | $312,610 | $29,410 | $283,200 |
| 2018 | $2,779 | $286,510 | $29,410 | $257,100 |
| 2017 | $2,278 | $234,810 | $29,410 | $205,400 |
| 2016 | $2,197 | $231,310 | $29,010 | $202,300 |
| 2015 | $2,197 | $231,310 | $29,010 | $202,300 |
| 2014 | $2,197 | $231,310 | $29,010 | $202,300 |
Source: Public Records
Map
Nearby Homes
- 310 Berkeley Place
- 201 N Market St
- 23 E Beverley St
- 101 W Village Dr Unit 103
- 138 Garber St
- 629 Baptist St
- 509 Randolph St
- 311 N Lewis St
- 17 N Washington St
- 501 W Frederick St
- 1203 Windsor Ln
- 110 N Jefferson St
- 20 N Jefferson St
- 115 S Jefferson St
- 822 W Beverley St
- 606 and 612 Mason St
- Lot 80 Lexington Ln
- 9 E Liberty St
- 730 Opie St
- 813 N Coalter St
- 340 Vine St
- 330 Vine St
- 325 Vine St
- 342 Vine St
- 326 Vine St
- 335 Vine St
- 415 E Beverley St
- 411 E Beverley St
- 320 Vine St
- 425 E Beverley St
- 325 Berkeley Place
- 145 N Coalter St
- 319 Vine St
- 405 E Beverley St
- 147 N Coalter St
- 321 Berkeley Place
- 437 E Beverley St
- 135 N Coalter St
- 314 Vine St
- 151 N Coalter St