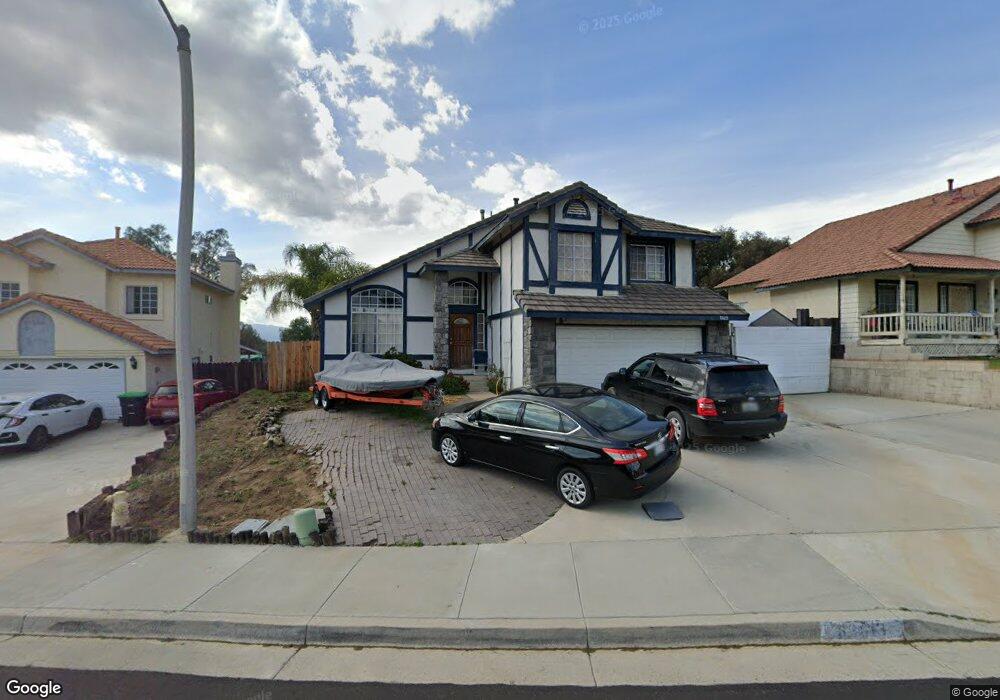
33613 View Crest Dr Wildomar, CA 92595
Estimated Value: $547,000 - $568,000
3
Beds
3
Baths
1,559
Sq Ft
$357/Sq Ft
Est. Value
About This Home
This home is located at 33613 View Crest Dr, Wildomar, CA 92595 and is currently estimated at $556,534, approximately $356 per square foot. 33613 View Crest Dr is a home located in Riverside County with nearby schools including Ronald Reagan Elementary School, David A. Brown Middle School, and Elsinore High School.
Ownership History
Date
Name
Owned For
Owner Type
Purchase Details
Closed on
Aug 7, 2025
Sold by
Margaret A Furman Living Trust and Furman Craig M
Bought by
Furman Craig M
Current Estimated Value
Purchase Details
Closed on
Jun 16, 2003
Sold by
Furman Margaret A
Bought by
Furman Margaret A and Margaret A Furman Living Trust
Home Financials for this Owner
Home Financials are based on the most recent Mortgage that was taken out on this home.
Original Mortgage
$90,500
Interest Rate
5.37%
Mortgage Type
Purchase Money Mortgage
Purchase Details
Closed on
Nov 16, 1993
Sold by
Furman Bertrand K and Furman Bertrand F
Bought by
Furman Bertrand K and Furman Margaret A
Home Financials for this Owner
Home Financials are based on the most recent Mortgage that was taken out on this home.
Original Mortgage
$97,828
Interest Rate
6.85%
Mortgage Type
FHA
Create a Home Valuation Report for This Property
The Home Valuation Report is an in-depth analysis detailing your home's value as well as a comparison with similar homes in the area
Home Values in the Area
Average Home Value in this Area
Purchase History
We collect this data history from publicly available records. To have your information removed, we recommend requesting removal directly through your county’s website.
| Date | Buyer | Sale Price | Title Company |
|---|---|---|---|
| Furman Craig M | -- | None Listed On Document | |
| Furman Margaret A | -- | Fidelity National Title Co | |
| Furman Bertrand K | -- | Orange Coast Title Co |
Source: Public Records
Mortgage History
We collect this data history from publicly available records. To have your information removed, we recommend requesting removal directly through your county’s website.
| Date | Status | Borrower | Loan Amount |
|---|---|---|---|
| Previous Owner | Furman Margaret A | $90,500 | |
| Previous Owner | Furman Bertrand K | $97,828 |
Source: Public Records
Tax History
| Year | Tax Paid | Tax Assessment Tax Assessment Total Assessment is a certain percentage of the fair market value that is determined by local assessors to be the total taxable value of land and additions on the property. | Land | Improvement |
|---|---|---|---|---|
| 2025 | $2,821 | $272,064 | $58,151 | $213,913 |
| 2023 | $2,821 | $261,501 | $55,894 | $205,607 |
| 2022 | $2,727 | $256,375 | $54,799 | $201,576 |
| 2021 | $2,675 | $251,349 | $53,725 | $197,624 |
| 2020 | $2,649 | $248,773 | $53,175 | $195,598 |
| 2019 | $2,598 | $243,896 | $52,133 | $191,763 |
| 2018 | $2,549 | $239,114 | $51,111 | $188,003 |
| 2017 | $2,500 | $234,426 | $50,109 | $184,317 |
| 2016 | $2,409 | $229,830 | $49,127 | $180,703 |
| 2015 | $2,381 | $226,380 | $48,390 | $177,990 |
| 2014 | $2,308 | $221,947 | $47,443 | $174,504 |
Source: Public Records
Map
Nearby Homes
- 22322 Hillshore Ct
- 22420 Shore View Ct
- 33467 Viewpoint Dr
- 22209 Blondon Ct
- 33732 Great Falls Rd
- 22154 Country Hills Dr
- 33737 Breckenridge Trail
- 0 Lost Unit SW26101550
- 0 Lost Unit SW23191889
- 22125 Country Hills Dr
- 33820 Canyon Ranch Rd
- 0 Cherry St
- 33599 Orange St
- 22873 Sheffield Ct
- 33123 Via Margarita St
- 34074 Autumn Sage Ct
- 22894 Brighton Ct
- 21890 Victorian Ln
- 34135 Orange St
- 557 Almond St
- 33605 View Crest Dr
- 33621 View Crest Dr
- 33597 View Crest Dr
- 33629 View Crest Dr
- 33589 View Crest Dr
- 33628 View Crest Dr
- 33620 View Crest Dr
- 33637 View Crest Dr
- 33634 View Crest Dr
- 33612 View Crest Dr
- 33604 View Crest Dr
- 33581 View Crest Dr
- 33642 View Crest Dr
- 33641 View Crest Dr
- 33596 View Crest Dr
- 33635 Sellers Rd
- 33650 View Crest Dr
- 33643 Sellers Rd
- 33575 View Crest Dr
- 22285 Lemon St
Your Personal Tour Guide
Ask me questions while you tour the home.