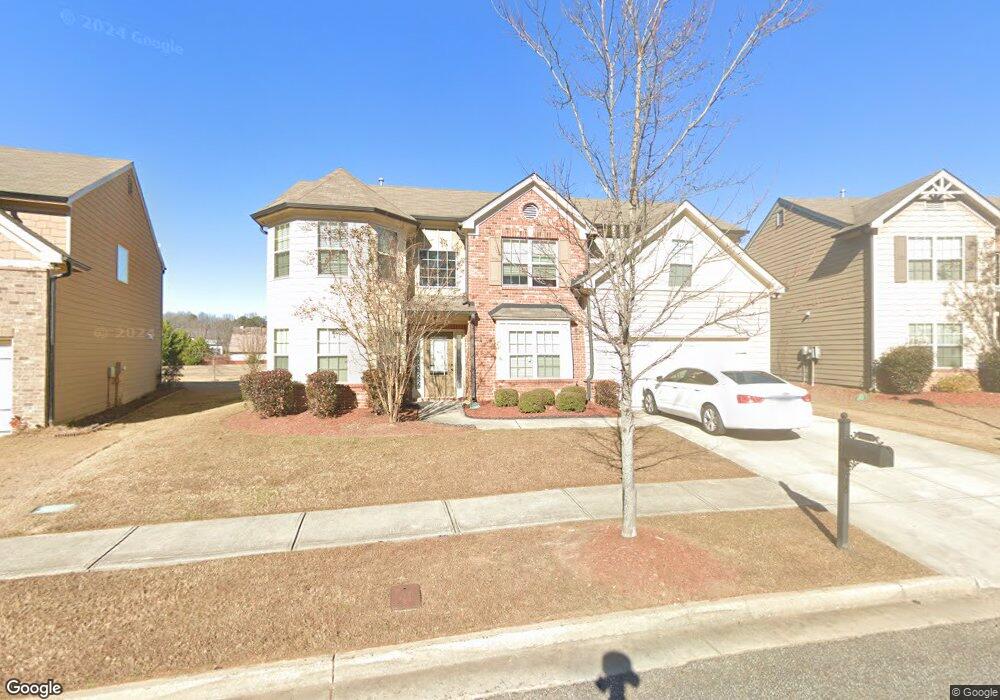
3363 Sag Harbor Ct NE Buford, GA 30519
Estimated Value: $460,252 - $544,000
About This Home
Please note, our homes are available on a first-come, first-serve basis and are not reserved until the holding fee agreement is signed and the holding fee is paid by the primary applicant.
This home is priced to rent and won't be around for long. Apply now, while we make this home ready for you, or call to arrange a meeting with your local Progress Residential leasing specialist today.
Gorgeous and spacious 5 bedroom, 3 bathroom rental home in Buford, GA! The open floor plan features an inviting great room with a fireplace and vaulted ceilings. The stunning kitchen is completely open to the great room and includes a stainless steel appliance package, granite countertops and a dining area. The large master bedroom includes a huge closet and a private en suite with dual sinks, a separate walk-in shower and a garden tub. You will love relaxing and entertaining in the beautiful backyard! Located in The Hamptons community, which offers a pool, clubhouse, park, playground and tennis courts. Schedule your tour and submit your application today!
Ownership History
Purchase Details
Purchase Details
Home Values in the Area
Average Home Value in this Area
Purchase History
| Date | Buyer | Sale Price | Title Company |
|---|---|---|---|
| Progress Residential 2014 1 Bo | -- | -- | |
| Freo Georgia Llc | $202,000 | -- | |
| Almont Homes Ne Inc | -- | -- |
Property History
| Date | Event | Price | List to Sale | Price per Sq Ft |
|---|---|---|---|---|
| 02/08/2025 02/08/25 | Price Changed | $2,530 | +2.0% | $1 / Sq Ft |
| 02/07/2025 02/07/25 | Price Changed | $2,480 | +0.2% | $1 / Sq Ft |
| 02/06/2025 02/06/25 | Price Changed | $2,475 | -26.8% | $1 / Sq Ft |
| 02/03/2025 02/03/25 | For Rent | -- | -- | -- |
| 01/01/2025 01/01/25 | Off Market | $3,380 | -- | -- |
| 12/26/2024 12/26/24 | For Rent | $3,380 | -- | -- |
Tax History Compared to Growth
Tax History
| Year | Tax Paid | Tax Assessment Tax Assessment Total Assessment is a certain percentage of the fair market value that is determined by local assessors to be the total taxable value of land and additions on the property. | Land | Improvement |
|---|---|---|---|---|
| 2024 | $5,703 | $177,400 | $37,600 | $139,800 |
| 2023 | $5,703 | $177,400 | $37,600 | $139,800 |
| 2022 | $5,622 | $149,480 | $34,000 | $115,480 |
| 2021 | $4,096 | $104,840 | $22,400 | $82,440 |
| 2020 | $4,120 | $104,840 | $22,400 | $82,440 |
| 2019 | $3,968 | $105,720 | $22,400 | $83,320 |
| 2018 | $3,379 | $87,920 | $19,200 | $68,720 |
| 2016 | $3,521 | $91,480 | $19,200 | $72,280 |
| 2015 | $3,209 | $81,560 | $16,000 | $65,560 |
| 2014 | $3,142 | $80,800 | $16,000 | $64,800 |
Map
- 4320 Easter Lily (Lot 13) Ave
- 3134 Victoria Park Ln
- 3123 Milloak Ct
- 3408 Hamilton Mill Rd
- 3468 Aberrone Place
- 2982 Hollow Mill Ln
- 3470 Hamilton Mill Rd
- 3487 Samantha Dr
- 2995 Ivy Mill Dr
- 3050 Ogden Trail
- 3238 Leyden Ct
- 3060 Hamilton Mill Rd
- 3379 Camp Branch Rd
- 3045 Camp Branch Rd
- 2988 Hamilton Mill Rd
- 3488 Hamilton Mill Rd
- 3105 Hamilton Mill Rd
- 3311 Lindenridge Dr
- 3596 Bendleton Dr
- 3363 Sag Harbor Ct Unit 3398
- 3363 Sag Harbor Ct
- 3363 Sag Harbor Ct
- 3373 Sag Harbor Ct
- 0 Sag Harbor Ct NE Unit 8534992
- 0 Sag Harbor Ct NE Unit 8395165
- 0 Sag Harbor Ct NE Unit 8393662
- 0 Sag Harbor Ct NE Unit 8363800
- 0 Sag Harbor Ct NE Unit 8345838
- 0 Sag Harbor Ct NE Unit 8325299
- 0 Sag Harbor Ct NE Unit 7547937
- 0 Sag Harbor Ct NE Unit 7547938
- 0 Sag Harbor Ct NE Unit 8711528
- 0 Sag Harbor Ct NE Unit 8167439
- 0 Sag Harbor Ct NE Unit 8100308
- 0 Sag Harbor Ct NE Unit 7513023
- 0 Sag Harbor Ct NE Unit 7553435
- 0 Sag Harbor Ct NE Unit 7423774
- 0 Sag Harbor Ct NE Unit 7160988
- 0 Sag Harbor Ct NE Unit 7166607