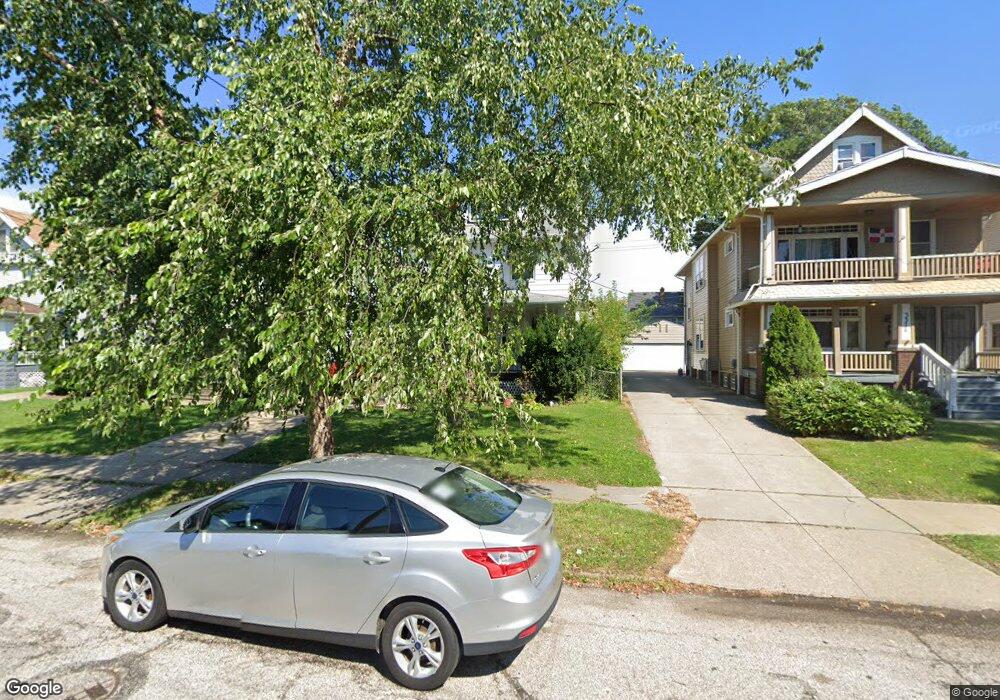
3367 W 100th St Cleveland, OH 44111
West Boulevard NeighborhoodEstimated Value: $125,000 - $147,000
4
Beds
2
Baths
1,177
Sq Ft
$117/Sq Ft
Est. Value
About This Home
This home is located at 3367 W 100th St, Cleveland, OH 44111 and is currently estimated at $137,355, approximately $116 per square foot. 3367 W 100th St is a home located in Cuyahoga County with nearby schools including Almira Academy, Artemus Ward School, and Benjamin Franklin.
Ownership History
Date
Name
Owned For
Owner Type
Purchase Details
Closed on
Nov 24, 2021
Sold by
Mohamniad Faik F and Shahadeh Wafa A
Bought by
Mohammad Hana F
Current Estimated Value
Purchase Details
Closed on
Jul 15, 1998
Sold by
Mohammad Wafa A
Bought by
Mohammad Faik F
Home Financials for this Owner
Home Financials are based on the most recent Mortgage that was taken out on this home.
Original Mortgage
$62,900
Interest Rate
6.8%
Purchase Details
Closed on
Jul 14, 1993
Sold by
Petz Colleen A
Bought by
Mohammad Faik F
Purchase Details
Closed on
Dec 7, 1988
Sold by
Murphy Nell L
Bought by
Petz Colleen A
Purchase Details
Closed on
Sep 8, 1988
Sold by
Murphy Denver and Murphy Niel L
Bought by
Murphy Nell L
Purchase Details
Closed on
May 3, 1985
Sold by
Torres Herminia
Bought by
Murphy Denver and Murphy Niel L
Purchase Details
Closed on
Jul 9, 1975
Sold by
Matheis Katharina
Bought by
Torres Herminia
Purchase Details
Closed on
Jan 1, 1975
Bought by
Matheis Katharina
Create a Home Valuation Report for This Property
The Home Valuation Report is an in-depth analysis detailing your home's value as well as a comparison with similar homes in the area
Home Values in the Area
Average Home Value in this Area
Purchase History
| Date | Buyer | Sale Price | Title Company |
|---|---|---|---|
| Mohammad Hana F | -- | None Available | |
| Mohammad Faik F | -- | Prospect Title Agency Inc | |
| Mohammad Faik F | $45,900 | -- | |
| Petz Colleen A | $37,000 | -- | |
| Murphy Nell L | -- | -- | |
| Murphy Denver | $36,000 | -- | |
| Torres Herminia | $28,000 | -- | |
| Matheis Katharina | -- | -- |
Source: Public Records
Mortgage History
| Date | Status | Borrower | Loan Amount |
|---|---|---|---|
| Closed | Mohammad Faik F | $62,900 |
Source: Public Records
Tax History Compared to Growth
Tax History
| Year | Tax Paid | Tax Assessment Tax Assessment Total Assessment is a certain percentage of the fair market value that is determined by local assessors to be the total taxable value of land and additions on the property. | Land | Improvement |
|---|---|---|---|---|
| 2024 | $2,497 | $37,345 | $7,490 | $29,855 |
| 2023 | $2,071 | $26,710 | $4,410 | $22,300 |
| 2022 | $2,059 | $26,710 | $4,410 | $22,300 |
| 2021 | $1,994 | $26,710 | $4,410 | $22,300 |
| 2020 | $1,775 | $20,550 | $3,400 | $17,150 |
| 2019 | $1,641 | $58,700 | $9,700 | $49,000 |
| 2018 | $1,535 | $20,550 | $3,400 | $17,150 |
| 2017 | $1,446 | $17,540 | $3,500 | $14,040 |
| 2016 | $1,435 | $17,540 | $3,500 | $14,040 |
| 2015 | $1,567 | $17,540 | $3,500 | $14,040 |
| 2014 | $1,567 | $19,080 | $3,820 | $15,260 |
Source: Public Records
Map
Nearby Homes
- 3329 W 99th St
- 3380 W 100th St
- 3301 West Blvd
- 3296 W 99th St
- 3281 W 99th St
- 10225 Bernard Ave
- 10216 Champion Ave
- 3305 W 97th St
- 3451 W 98th St
- 10402 Almira Ave
- 3408 W 95th St
- 9414 Almira Ave
- 10310 Adelaide Ave
- 10404 Joan Ave
- 3318 W 94th St
- 10113 Loretta Ave
- 3414 W 94th St
- 9510 Denison Ave
- 3512 W 98th St
- 3497 W 97th St
- 3371 W 100th St
- 3365 W 100th St
- 3375 W 100th St
- 3359 W 100th St
- 3368 W 99th St
- 3372 W 99th St
- 3364 W 99th St
- 3379 W 100th St
- 3376 W 99th St
- 3360 W 99th St
- 3383 W 100th St
- 3380 W 99th St
- 3368 W 100th St
- 3364 W 100th St
- 3372 W 100th St
- 3360 W 100th St
- 3384 W 99th St
- 3376 W 100th St
- 3387 W 100th St
- 3347 W 100th St