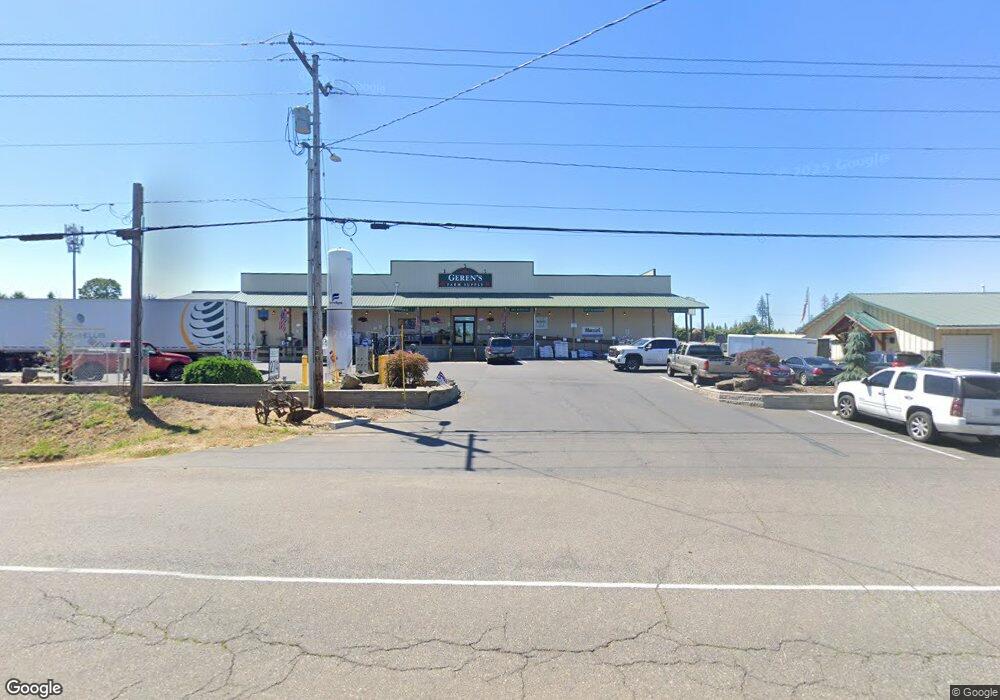
33680 SE Kelso Rd Boring, OR 97009
Estimated Value: $1,611,188
--
Bed
--
Bath
13,060
Sq Ft
$123/Sq Ft
Est. Value
About This Home
This home is located at 33680 SE Kelso Rd, Boring, OR 97009 and is currently estimated at $1,611,188, approximately $123 per square foot. 33680 SE Kelso Rd is a home located in Clackamas County with nearby schools including Kelso Elementary School, Boring Middle School, and Sandy High School.
Ownership History
Date
Name
Owned For
Owner Type
Purchase Details
Closed on
Nov 30, 2021
Sold by
Lekaroz Limited Partnership
Bought by
Double Av Llc
Current Estimated Value
Home Financials for this Owner
Home Financials are based on the most recent Mortgage that was taken out on this home.
Original Mortgage
$475,000
Outstanding Balance
$217,433
Interest Rate
3.09%
Mortgage Type
Commercial
Estimated Equity
$1,393,755
Purchase Details
Closed on
Jun 4, 2001
Sold by
Mcdermed Donna M
Bought by
Lekaroz Ltd Partnership
Home Financials for this Owner
Home Financials are based on the most recent Mortgage that was taken out on this home.
Original Mortgage
$249,000
Interest Rate
7.14%
Mortgage Type
Commercial
Purchase Details
Closed on
Aug 1, 1990
Bought by
Geren Leslie
Create a Home Valuation Report for This Property
The Home Valuation Report is an in-depth analysis detailing your home's value as well as a comparison with similar homes in the area
Home Values in the Area
Average Home Value in this Area
Purchase History
| Date | Buyer | Sale Price | Title Company |
|---|---|---|---|
| Double Av Llc | $1,505,000 | First American Title | |
| Lekaroz Limited Partnership | -- | First American Title | |
| Lekaroz Ltd Partnership | -- | First American Title Ins Co | |
| Geren Leslie | $300,000 | -- |
Source: Public Records
Mortgage History
| Date | Status | Borrower | Loan Amount |
|---|---|---|---|
| Open | Double Av Llc | $475,000 | |
| Previous Owner | Lekaroz Ltd Partnership | $249,000 |
Source: Public Records
Tax History Compared to Growth
Tax History
| Year | Tax Paid | Tax Assessment Tax Assessment Total Assessment is a certain percentage of the fair market value that is determined by local assessors to be the total taxable value of land and additions on the property. | Land | Improvement |
|---|---|---|---|---|
| 2025 | $17,207 | $1,191,817 | -- | -- |
| 2024 | $16,441 | $1,157,104 | -- | -- |
| 2023 | $16,441 | $1,123,402 | $0 | $0 |
| 2022 | $15,023 | $1,090,682 | $0 | $0 |
| 2021 | $14,483 | $1,058,915 | $0 | $0 |
| 2020 | $14,108 | $1,028,073 | $0 | $0 |
| 2019 | $14,054 | $998,130 | $0 | $0 |
| 2018 | $13,652 | $969,058 | $0 | $0 |
| 2017 | $13,351 | $940,833 | $0 | $0 |
| 2016 | $12,757 | $913,430 | $0 | $0 |
| 2015 | $12,396 | $886,825 | $0 | $0 |
| 2014 | $12,080 | $860,995 | $0 | $0 |
Source: Public Records
Map
Nearby Homes
- 33685 SE Kelso Rd
- 13651 SE Orient Dr
- 34603 SE Jarl Rd
- 13025 SE Orient Dr Unit 8
- 35543 SE Crescent Rd
- 35600 SE Dunn Rd
- 35645 SE Dunn Rd
- 12250 SE 352nd Ave
- 16765 Champion Way
- 35000 SE Bell Maple Dr
- 16825 Chula Vista Ave
- 32900 SE Colorado Rd
- 36904 Salmonberry St
- 34000 SE Colorado Rd
- 37287 American St
- 36280 SE Hauglum Rd
- 15280 Penny Ave
- 16370 Bell St
- 16370 Bell St Unit 2
- 0 SE Jewelberry Ave Unit 648659733
- 33804 SE Kelso Rd
- 33838 SE Kelso Rd
- 33888 SE Kelso Rd
- 33930 SE Kelso Rd
- 34064 SE Highway 26
- 33811 SE Highway 26
- 34024 SE Kelso Rd
- 33975 SE Kelso Rd
- 33242 SE Kelso Rd
- 33201 SE Kelso Rd
- 34110 SE Relisted
- 34110 SE Kelso Rd
- 33166 SE Kelso Rd
- 14321 SE 340th Ct
- 34051 SE Kelso Rd
- 33401 SE Kelso Rd
- 34160 SE Kelso Rd
- 33597 SE Kelso Rd
- 34165 SE Kelso Rd
- 33130 SE Kelso Rd