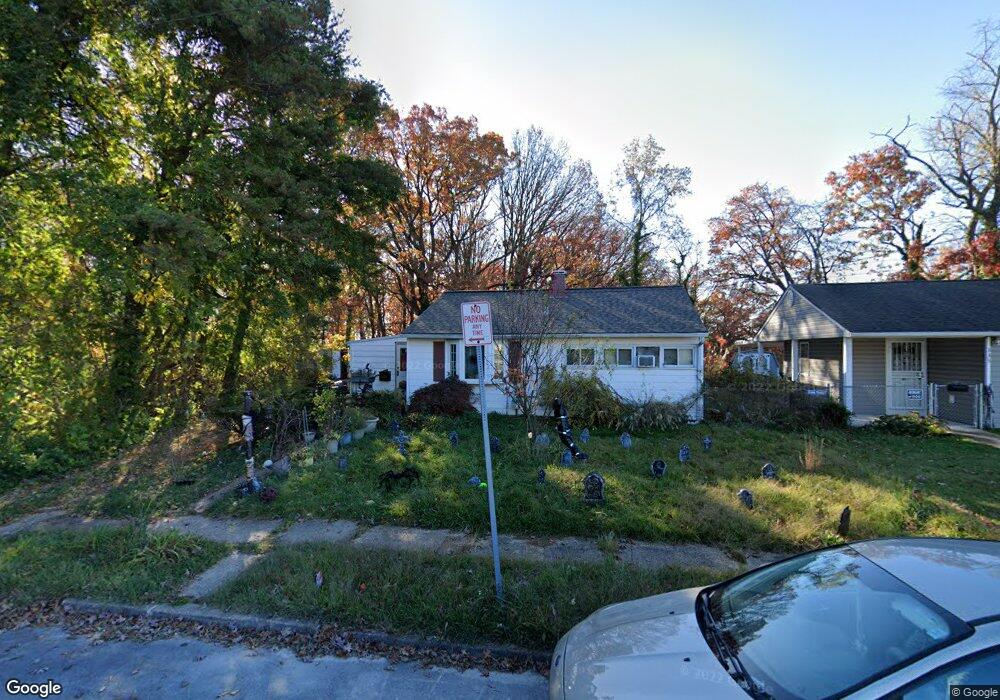
337 Clyde Ave Halethorpe, MD 21227
Lansdowne NeighborhoodEstimated Value: $216,310 - $273,000
--
Bed
1
Bath
700
Sq Ft
$362/Sq Ft
Est. Value
About This Home
This home is located at 337 Clyde Ave, Halethorpe, MD 21227 and is currently estimated at $253,078, approximately $361 per square foot. 337 Clyde Ave is a home located in Baltimore County with nearby schools including Lansdowne Elementary School, Lansdowne Middle School, and Lansdowne High School.
Ownership History
Date
Name
Owned For
Owner Type
Purchase Details
Closed on
Apr 26, 2006
Sold by
Mccauley James L
Bought by
Reeder Brenda
Current Estimated Value
Home Financials for this Owner
Home Financials are based on the most recent Mortgage that was taken out on this home.
Original Mortgage
$111,500
Outstanding Balance
$69,254
Interest Rate
7.7%
Mortgage Type
Stand Alone Refi Refinance Of Original Loan
Estimated Equity
$183,824
Purchase Details
Closed on
Aug 24, 2005
Sold by
Mccauley James L
Bought by
Reeder Brenda
Home Financials for this Owner
Home Financials are based on the most recent Mortgage that was taken out on this home.
Original Mortgage
$111,500
Interest Rate
7.7%
Mortgage Type
New Conventional
Purchase Details
Closed on
Nov 4, 1999
Sold by
Burns Donald R
Bought by
Mccauley James L and Reeder Brenda
Purchase Details
Closed on
Jun 12, 1990
Sold by
Kucheravy Walter Scott
Bought by
Burns Donald R
Create a Home Valuation Report for This Property
The Home Valuation Report is an in-depth analysis detailing your home's value as well as a comparison with similar homes in the area
Home Values in the Area
Average Home Value in this Area
Purchase History
| Date | Buyer | Sale Price | Title Company |
|---|---|---|---|
| Reeder Brenda | -- | -- | |
| Reeder Brenda | -- | -- | |
| Mccauley James L | $82,900 | -- | |
| Burns Donald R | $76,000 | -- |
Source: Public Records
Mortgage History
| Date | Status | Borrower | Loan Amount |
|---|---|---|---|
| Open | Reeder Brenda | $111,500 | |
| Previous Owner | Reeder Brenda | $111,500 |
Source: Public Records
Tax History Compared to Growth
Tax History
| Year | Tax Paid | Tax Assessment Tax Assessment Total Assessment is a certain percentage of the fair market value that is determined by local assessors to be the total taxable value of land and additions on the property. | Land | Improvement |
|---|---|---|---|---|
| 2025 | $2,492 | $158,833 | -- | -- |
| 2024 | $2,492 | $152,000 | $62,200 | $89,800 |
| 2023 | $1,193 | $146,633 | $0 | $0 |
| 2022 | $2,350 | $141,267 | $0 | $0 |
| 2021 | $2,127 | $135,900 | $62,200 | $73,700 |
| 2020 | $2,127 | $135,567 | $0 | $0 |
| 2019 | $2,373 | $135,233 | $0 | $0 |
| 2018 | $2,412 | $134,900 | $62,200 | $72,700 |
| 2017 | $2,495 | $134,467 | $0 | $0 |
| 2016 | $1,735 | $134,033 | $0 | $0 |
| 2015 | $1,735 | $133,600 | $0 | $0 |
| 2014 | $1,735 | $133,600 | $0 | $0 |
Source: Public Records
Map
Nearby Homes
- 2423 Alma Rd
- 216 Clyde Ave
- 3507 Clover Ave
- 817 5th Ave
- 121 1st Ave
- 2500 Gehb Ave
- 4007 Hollins Ferry Rd
- 130 5th Ave
- 121 3rd Ave
- 3204 Elizabeth Ave
- 2523 Gehb Ave
- 2323 W Patapsco Ave
- 4157 Hollins Ferry Rd
- 3055 Freeway
- 3103 Ryerson Cir
- 3100 Savoy St
- 2513 Marbourne Ave
- 2557 Southdene Ave
- 2704 Marbourne Ave
- 2707 Marbourne Ave