
Seller's Agent in 2025
Jacob Neal
BHHS Drysdale Properties
(209) 642-2292
19 in this area
47 Total Sales
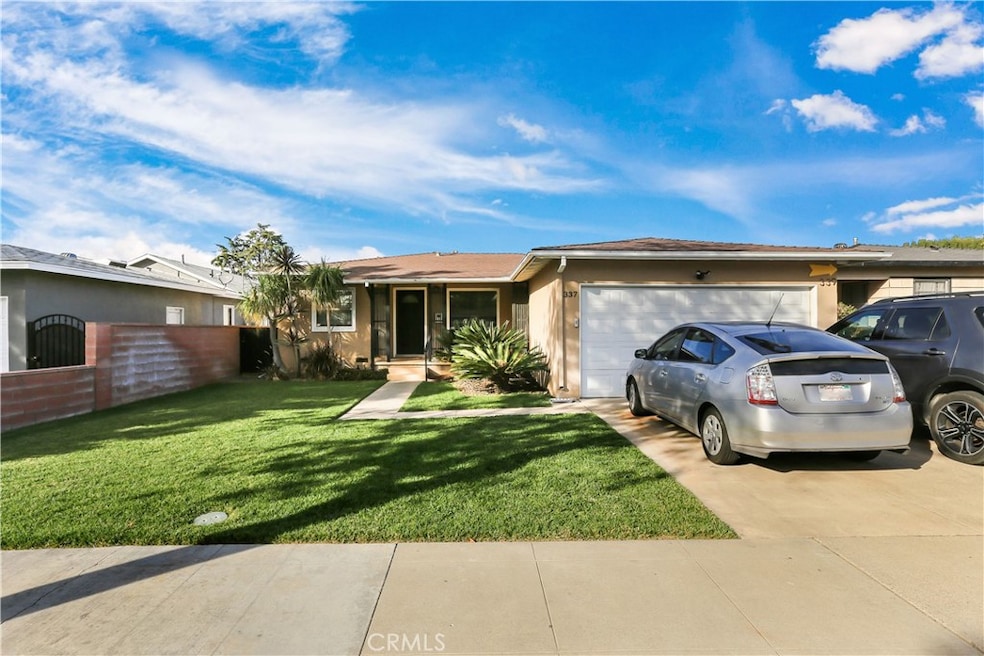
Exceptional investment opportunity just one block from Chapman University. This property features two fully leased homes generating $11,200 in monthly rental income. The front house offers 3(4) bedrooms and 2 bathrooms, while the grandfathered back house provides 4 bedrooms and 4 bathrooms—a rare setup that maximizes rent potential. Both homes are designed for student living with private bedrooms, multiple bathrooms, and functional layouts that remain in high demand year after year. Located in one of Orange’s most desirable student housing corridors, the property benefits from strong, consistent occupancy and proximity to campus, Old Towne Orange, shopping, and dining. With Chapman’s continued growth and limited nearby housing supply, 337 / 339 E Everett presents investors with immediate cash flow, long-term upside, and minimal vacancy risk in a proven rental market.
Last Agent to Sell the Property
BHHS Drysdale Properties Brokerage Phone: 209-642-2292 License #02097852 Listed on: 09/11/2025
| Date | Type | Sale Price | Title Company |
|---|---|---|---|
| Grant Deed | -- | None Listed On Document | |
| Quit Claim Deed | -- | California Best Title | |
| Grant Deed | $1,975,000 | California Best Title | |
| Grant Deed | $1,667,500 | Ticor Title | |
| Grant Deed | $631,000 | Western Resources Title Co | |
| Grant Deed | $645,000 | Orange Coast Title | |
| Interfamily Deed Transfer | -- | Fidelity National Title | |
| Interfamily Deed Transfer | -- | Accommodation | |
| Interfamily Deed Transfer | -- | Fidelity National Title | |
| Interfamily Deed Transfer | -- | None Available | |
| Interfamily Deed Transfer | -- | None Available | |
| Grant Deed | $350,000 | Equity Title Orange County-I | |
| Grant Deed | $170,000 | Orange Coast Title | |
| Interfamily Deed Transfer | -- | -- |
| Date | Status | Loan Amount | Loan Type |
|---|---|---|---|
| Previous Owner | $1,000,000 | New Conventional | |
| Previous Owner | $1,360,000 | New Conventional | |
| Previous Owner | $1,024,800 | Commercial | |
| Previous Owner | $580,500 | Purchase Money Mortgage | |
| Previous Owner | $356,000 | New Conventional | |
| Previous Owner | $314,615 | FHA | |
| Previous Owner | $318,150 | FHA | |
| Previous Owner | $173,298 | VA |
| Date | Event | Price | List to Sale | Price per Sq Ft | Prior Sale |
|---|---|---|---|---|---|
| 11/14/2025 11/14/25 | Sold | $1,975,000 | -5.7% | $973 / Sq Ft | |
| 10/24/2025 10/24/25 | Pending | -- | -- | -- | |
| 09/11/2025 09/11/25 | For Sale | $2,095,000 | 0.0% | $1,032 / Sq Ft | |
| 04/25/2022 04/25/22 | Rented | $4,500 | +0.7% | -- | |
| 04/14/2022 04/14/22 | Under Contract | -- | -- | -- | |
| 03/31/2022 03/31/22 | Price Changed | $4,470 | -57.1% | $5 / Sq Ft | |
| 02/12/2022 02/12/22 | For Rent | $10,430 | 0.0% | -- | |
| 03/09/2020 03/09/20 | Sold | $631,000 | -6.5% | $613 / Sq Ft | View Prior Sale |
| 11/23/2019 11/23/19 | Price Changed | $675,000 | -2.2% | $655 / Sq Ft | |
| 09/27/2019 09/27/19 | For Sale | $690,000 | 0.0% | $670 / Sq Ft | |
| 05/02/2019 05/02/19 | Rented | $3,200 | 0.0% | -- | |
| 05/01/2019 05/01/19 | Under Contract | -- | -- | -- | |
| 04/04/2019 04/04/19 | For Rent | $3,200 | 0.0% | -- | |
| 12/28/2018 12/28/18 | Sold | $645,000 | -0.6% | $655 / Sq Ft | View Prior Sale |
| 11/18/2018 11/18/18 | For Sale | $649,000 | +0.6% | $660 / Sq Ft | |
| 11/08/2018 11/08/18 | Off Market | $645,000 | -- | -- | |
| 11/08/2018 11/08/18 | Pending | -- | -- | -- | |
| 10/23/2018 10/23/18 | Price Changed | $649,000 | -3.8% | $660 / Sq Ft | |
| 10/02/2018 10/02/18 | For Sale | $674,900 | -- | $686 / Sq Ft |
| Year | Tax Paid | Tax Assessment Tax Assessment Total Assessment is a certain percentage of the fair market value that is determined by local assessors to be the total taxable value of land and additions on the property. | Land | Improvement |
|---|---|---|---|---|
| 2025 | $18,888 | $1,769,882 | $1,510,768 | $259,114 |
| 2024 | $18,888 | $1,735,179 | $1,481,145 | $254,034 |
| 2023 | $18,477 | $1,701,156 | $1,452,103 | $249,053 |
| 2022 | $9,254 | $828,080 | $598,983 | $229,097 |
| 2021 | $7,172 | $637,537 | $587,238 | $50,299 |
| 2020 | $7,252 | $657,900 | $607,063 | $50,837 |
| 2019 | $7,161 | $645,000 | $595,159 | $49,841 |
| 2018 | $4,503 | $398,708 | $346,859 | $51,849 |
| 2017 | $4,318 | $390,891 | $340,058 | $50,833 |
| 2016 | $4,234 | $383,227 | $333,390 | $49,837 |
| 2015 | $4,171 | $377,471 | $328,382 | $49,089 |
| 2014 | $4,081 | $370,077 | $321,949 | $48,128 |
Seller's Agent in 2025
Jacob Neal
BHHS Drysdale Properties
(209) 642-2292
19 in this area
47 Total Sales
C
Buyer's Agent in 2025
Chloe Amen
Luxe Real Estate
(949) 274-1619
2 in this area
4 Total Sales
C
Seller's Agent in 2020
Christopher Adams
Luxre Realty, Inc.
Seller Co-Listing Agent in 2020
Sher Sheldon
Luxre Realty, Inc.
(949) 315-5500
1 in this area
16 Total Sales
Buyer's Agent in 2020
Dan Lewin
Younglewin Advisors, Inc.
(310) 720-7939
2 in this area
21 Total Sales
Seller's Agent in 2019
Daniel Deforest
First Team Real Estate North Tustin
(714) 362-7192
21 in this area
170 Total Sales
Source: California Regional Multiple Listing Service (CRMLS)
MLS Number: OC25214986
APN: 039-201-05
Disclaimer: Certain information contained herein is derived from information provided by parties other than Homes.com. All information provided is deemed reliable, but is not guaranteed to be accurate and should be independently verified.
![]() The multiple listing data appearing on this website, or contained in reports produced therefrom, is owned and copyrighted by California Regional Multiple Listing Service, Inc. ("CRMLS") and is protected by all applicable copyright laws. Information provided is for viewer's personal, non-commercial use and may not be used for any purpose other than to identify prospective properties the viewer may be interested in purchasing. All listing data, including but not limited to square footage and lot size is believed to be accurate, but the listing Agent, listing Broker and CRMLS and its affiliates do not warrant or guarantee such accuracy. The viewer should independently verify the listed data prior to making any decisions based on such information by personal inspection and/or contacting a real estate professional.
The multiple listing data appearing on this website, or contained in reports produced therefrom, is owned and copyrighted by California Regional Multiple Listing Service, Inc. ("CRMLS") and is protected by all applicable copyright laws. Information provided is for viewer's personal, non-commercial use and may not be used for any purpose other than to identify prospective properties the viewer may be interested in purchasing. All listing data, including but not limited to square footage and lot size is believed to be accurate, but the listing Agent, listing Broker and CRMLS and its affiliates do not warrant or guarantee such accuracy. The viewer should independently verify the listed data prior to making any decisions based on such information by personal inspection and/or contacting a real estate professional.
Based on information from California Regional Multiple Listing Service, Inc. and /or other sources. All data, including all measurements and calculations of area, is obtained from various sources and has not been, and will not be, verified by broker or MLS. All information should be independently reviewed and verified for accuracy. Properties may or may not be listed by the office/agent presenting the information
Ask me questions while you tour the home.