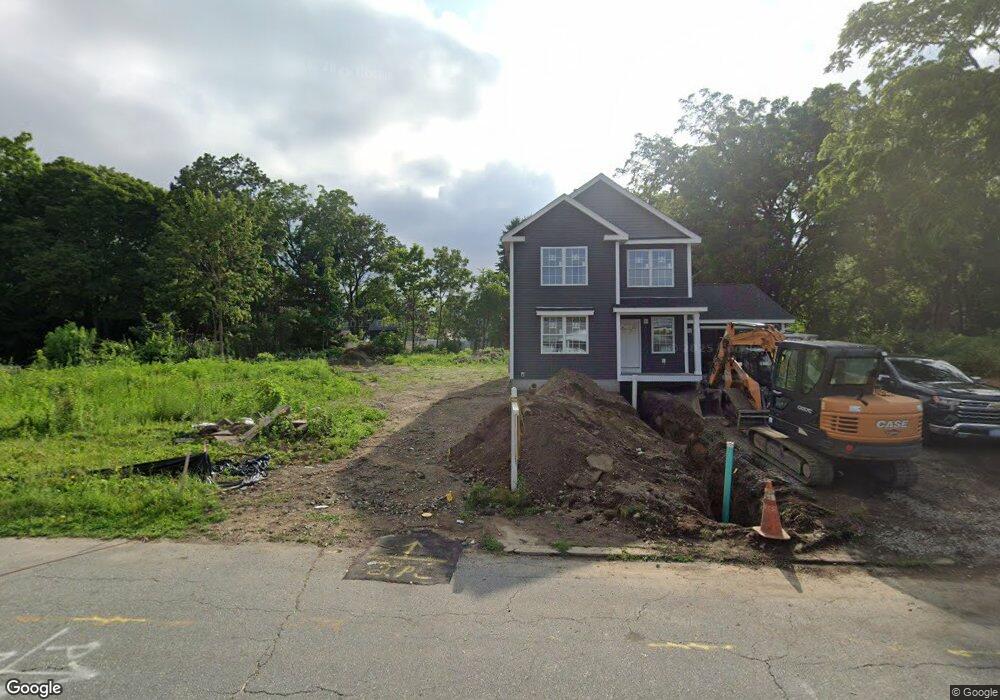
337 East St Cranston, RI 02920
Mayfield NeighborhoodEstimated Value: $300,000 - $394,000
3
Beds
1
Bath
1,328
Sq Ft
$266/Sq Ft
Est. Value
About This Home
This home is located at 337 East St, Cranston, RI 02920 and is currently estimated at $353,333, approximately $266 per square foot. 337 East St is a home located in Providence County with nearby schools including Garden City School, Western Hills Middle School, and Cranston High School West.
Ownership History
Date
Name
Owned For
Owner Type
Purchase Details
Closed on
Jan 29, 2025
Sold by
Boscia Michael and Boscia Dawn M
Bought by
David Building Co Llc
Current Estimated Value
Home Financials for this Owner
Home Financials are based on the most recent Mortgage that was taken out on this home.
Original Mortgage
$695,000
Outstanding Balance
$690,089
Interest Rate
6.72%
Mortgage Type
Purchase Money Mortgage
Estimated Equity
-$336,756
Purchase Details
Closed on
Sep 1, 2011
Sold by
Zarli-Bloomquis Kristine
Bought by
Boscia Michael and Boscia Dawn
Purchase Details
Closed on
Mar 1, 1996
Sold by
Zarli Michael N and Snowden Josephine M
Bought by
Bloomquist Robert D and Bloomquist Kristine
Create a Home Valuation Report for This Property
The Home Valuation Report is an in-depth analysis detailing your home's value as well as a comparison with similar homes in the area
Home Values in the Area
Average Home Value in this Area
Purchase History
| Date | Buyer | Sale Price | Title Company |
|---|---|---|---|
| David Building Co Llc | $675,000 | None Available | |
| David Building Co Llc | $675,000 | None Available | |
| Boscia Michael | -- | -- | |
| Boscia Michael | -- | -- | |
| Bloomquist Robert D | $108,000 | -- | |
| Bloomquist Robert D | $108,000 | -- |
Source: Public Records
Mortgage History
| Date | Status | Borrower | Loan Amount |
|---|---|---|---|
| Open | David Building Co Llc | $695,000 | |
| Closed | David Building Co Llc | $695,000 | |
| Previous Owner | Bloomquist Robert D | $40,000 | |
| Previous Owner | Bloomquist Robert D | $164,000 |
Source: Public Records
Tax History Compared to Growth
Tax History
| Year | Tax Paid | Tax Assessment Tax Assessment Total Assessment is a certain percentage of the fair market value that is determined by local assessors to be the total taxable value of land and additions on the property. | Land | Improvement |
|---|---|---|---|---|
| 2024 | $1,897 | $139,400 | $139,400 | $0 |
| 2023 | $1,767 | $93,500 | $91,700 | $1,800 |
| 2022 | $1,731 | $93,500 | $91,700 | $1,800 |
| 2021 | $2,207 | $122,600 | $91,700 | $30,900 |
| 2020 | $4,204 | $202,400 | $87,300 | $115,100 |
| 2019 | $4,204 | $202,400 | $87,300 | $115,100 |
| 2018 | $4,107 | $202,400 | $87,300 | $115,100 |
| 2017 | $3,925 | $171,100 | $78,600 | $92,500 |
| 2016 | $3,841 | $171,100 | $78,600 | $92,500 |
| 2015 | $3,841 | $171,100 | $78,600 | $92,500 |
| 2014 | $3,917 | $171,500 | $78,600 | $92,900 |
Source: Public Records
Map
Nearby Homes
- 5 High St
- 48 Central St
- 17 Jennie St
- 14 W Natick Rd
- 10 East St Unit 205
- 10 East St Unit 316
- 83 Fessenden St
- 12 Hagen Ave
- 52 Kalmer Rd
- 5 Versailles St
- 1011 Williamsburg Cir
- 61 Carnation Dr
- 1 Sunrise Rd
- 20 Manor Rd
- 995 Williamsburg Cir
- 69 Haverhill Ave
- 142 Edaville Ct
- 192 Burdick Dr
- 103 Edaville Ct
- 755 Williamsburg Cir