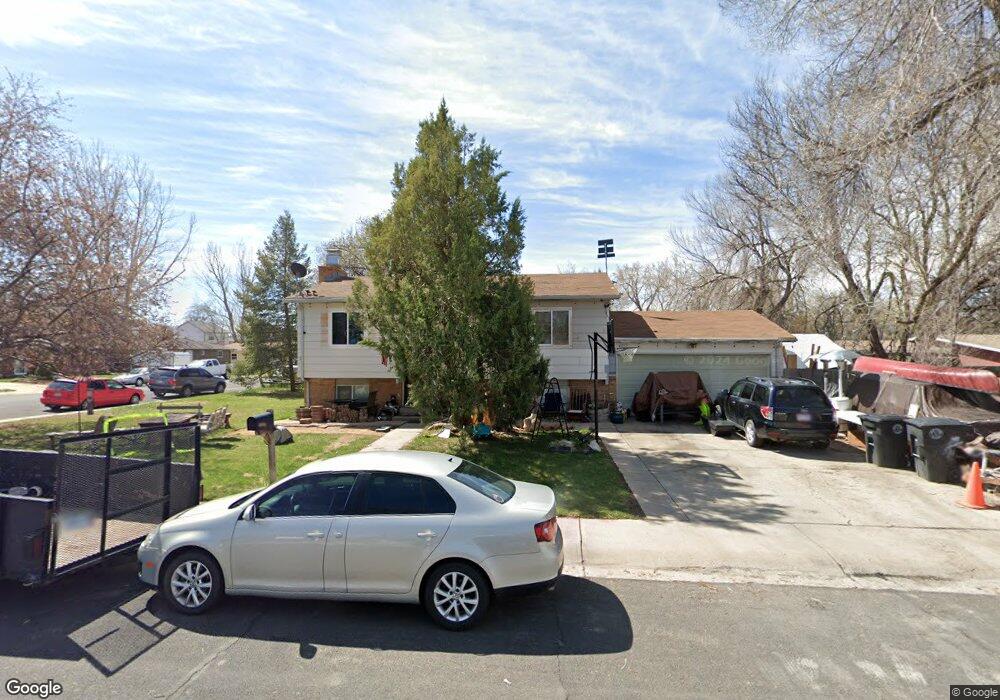
337 Meeker Place Longmont, CO 80504
Kensington NeighborhoodEstimated Value: $424,000 - $453,000
4
Beds
2
Baths
861
Sq Ft
$506/Sq Ft
Est. Value
About This Home
This home is located at 337 Meeker Place, Longmont, CO 80504 and is currently estimated at $435,873, approximately $506 per square foot. 337 Meeker Place is a home located in Boulder County with nearby schools including Columbine Elementary School, Trail Ridge Middle School, and Skyline High School.
Ownership History
Date
Name
Owned For
Owner Type
Purchase Details
Closed on
Dec 19, 2003
Sold by
Dufraine Michael S and Dufraine Leah A
Bought by
Thibodeau Rachel D
Current Estimated Value
Home Financials for this Owner
Home Financials are based on the most recent Mortgage that was taken out on this home.
Original Mortgage
$120,000
Outstanding Balance
$54,126
Interest Rate
5.5%
Mortgage Type
Purchase Money Mortgage
Estimated Equity
$381,747
Purchase Details
Closed on
Jan 28, 1997
Sold by
Dufraine Leah Ann
Bought by
Dufraine Michael S
Home Financials for this Owner
Home Financials are based on the most recent Mortgage that was taken out on this home.
Original Mortgage
$55,000
Interest Rate
8.75%
Purchase Details
Closed on
Mar 29, 1985
Bought by
Thibodeau Rachel D
Purchase Details
Closed on
Aug 2, 1983
Bought by
Thibodeau Rachel D
Purchase Details
Closed on
Oct 6, 1978
Bought by
Thibodeau Rachel D
Create a Home Valuation Report for This Property
The Home Valuation Report is an in-depth analysis detailing your home's value as well as a comparison with similar homes in the area
Home Values in the Area
Average Home Value in this Area
Purchase History
| Date | Buyer | Sale Price | Title Company |
|---|---|---|---|
| Thibodeau Rachel D | $175,000 | Land Title | |
| Dufraine Leah A | -- | Land Title | |
| Dufraine Michael S | -- | -- | |
| Thibodeau Rachel D | -- | -- | |
| Thibodeau Rachel D | $64,900 | -- | |
| Thibodeau Rachel D | $51,500 | -- |
Source: Public Records
Mortgage History
| Date | Status | Borrower | Loan Amount |
|---|---|---|---|
| Open | Thibodeau Rachel D | $120,000 | |
| Previous Owner | Dufraine Michael S | $55,000 |
Source: Public Records
Tax History Compared to Growth
Tax History
| Year | Tax Paid | Tax Assessment Tax Assessment Total Assessment is a certain percentage of the fair market value that is determined by local assessors to be the total taxable value of land and additions on the property. | Land | Improvement |
|---|---|---|---|---|
| 2025 | $2,130 | $23,982 | $10,288 | $13,694 |
| 2024 | $2,130 | $23,982 | $10,288 | $13,694 |
| 2023 | $2,101 | $22,264 | $11,290 | $14,660 |
| 2022 | $1,924 | $19,439 | $7,944 | $11,495 |
| 2021 | $1,948 | $19,998 | $8,172 | $11,826 |
| 2020 | $1,706 | $17,560 | $6,864 | $10,696 |
| 2019 | $1,679 | $17,560 | $6,864 | $10,696 |
| 2018 | $1,448 | $15,242 | $5,904 | $9,338 |
| 2017 | $1,428 | $16,851 | $6,527 | $10,324 |
| 2016 | $1,274 | $13,333 | $5,333 | $8,000 |
| 2015 | $1,214 | $12,155 | $3,980 | $8,175 |
| 2014 | $1,135 | $12,155 | $3,980 | $8,175 |
Source: Public Records
Map
Nearby Homes
- 884 Elliott St
- 225 E 8th Ave Unit E20
- 225 E 8th Ave Unit A2
- 225 E 8th Ave Unit E10
- 741 Elliott St
- 811 Brookside Dr
- 146 E Saint Clair Ave Unit 148
- 756 Brookside Dr
- 742 Megan Ct
- 712 Pendleton Ave
- 149 E 6th Ave
- 908 Sugar Mill Ave
- 713 Pendleton Ave
- 902 Sugar Mill Ave
- 262 E 5th Ave
- 618 Silver Star Ct
- 845 Martin St
- 620 Independence Dr
- 641 Martin St
- 247 Wadsworth Cir
- 833 Hilltop St
- 838 Mount Evans St
- 832 Mount Evans St
- 827 Hilltop St
- 336 Meeker Place
- 840 Hilltop St
- 330 Meeker Place
- 342 Meeker Place
- 834 Hilltop St
- 826 Mount Evans St
- 846 Hilltop St
- 324 Meeker Place
- 821 Hilltop St
- 828 Hilltop St
- 348 Meeker Place
- 820 Mount Evans St
- 318 Meeker Place
- 822 Hilltop St
- 843 Alpine St
- 815 Hilltop St