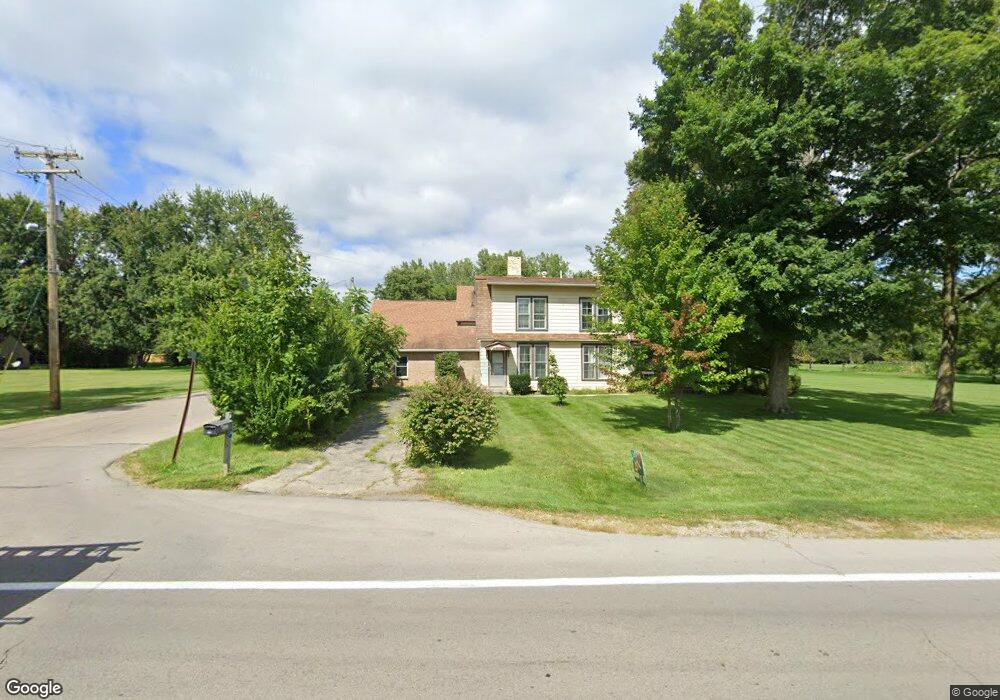
3376 E High St Springfield, OH 45505
Estimated Value: $312,000 - $351,000
4
Beds
2
Baths
2,776
Sq Ft
$120/Sq Ft
Est. Value
About This Home
This home is located at 3376 E High St, Springfield, OH 45505 and is currently estimated at $331,908, approximately $119 per square foot. 3376 E High St is a home located in Clark County with nearby schools including Possum Elementary School, Shawnee Middle School/High School, and Catholic Central Elementary School - Lagonda Campus.
Ownership History
Date
Name
Owned For
Owner Type
Purchase Details
Closed on
Apr 25, 2001
Sold by
Napier Marvin C and Napier Carolyn S
Bought by
Mccune Lee J and Pinkerton Sandra L
Current Estimated Value
Home Financials for this Owner
Home Financials are based on the most recent Mortgage that was taken out on this home.
Original Mortgage
$111,200
Outstanding Balance
$39,032
Interest Rate
6.87%
Estimated Equity
$292,876
Purchase Details
Closed on
Feb 5, 1993
Create a Home Valuation Report for This Property
The Home Valuation Report is an in-depth analysis detailing your home's value as well as a comparison with similar homes in the area
Home Values in the Area
Average Home Value in this Area
Purchase History
| Date | Buyer | Sale Price | Title Company |
|---|---|---|---|
| Mccune Lee J | $139,000 | -- | |
| -- | $87,000 | -- |
Source: Public Records
Mortgage History
| Date | Status | Borrower | Loan Amount |
|---|---|---|---|
| Open | Mccune Lee J | $111,200 |
Source: Public Records
Tax History
| Year | Tax Paid | Tax Assessment Tax Assessment Total Assessment is a certain percentage of the fair market value that is determined by local assessors to be the total taxable value of land and additions on the property. | Land | Improvement |
|---|---|---|---|---|
| 2025 | $4,018 | $101,210 | $20,750 | $80,460 |
| 2024 | $3,914 | $80,050 | $15,030 | $65,020 |
| 2023 | $3,914 | $80,050 | $15,030 | $65,020 |
| 2022 | $3,882 | $80,050 | $15,030 | $65,020 |
| 2021 | $3,379 | $62,380 | $11,650 | $50,730 |
| 2020 | $3,407 | $62,380 | $11,650 | $50,730 |
| 2019 | $3,461 | $62,380 | $11,650 | $50,730 |
| 2018 | $3,530 | $62,770 | $10,590 | $52,180 |
| 2017 | $3,618 | $62,766 | $10,588 | $52,178 |
| 2016 | $3,265 | $62,766 | $10,588 | $52,178 |
| 2015 | $3,278 | $60,915 | $10,588 | $50,327 |
| 2014 | $3,287 | $60,915 | $10,588 | $50,327 |
| 2013 | $2,856 | $60,915 | $10,588 | $50,327 |
Source: Public Records
Map
Nearby Homes
- 507 Elbron Rd
- 224 Mackinac Dr
- 224 Roebling St
- 218 Golden Gate Ave
- 631 Kramer Rd
- 255 S Bird Rd
- 180 Chesapeake Cir
- 3012 E High St
- 451 Lawnview Ave
- 138 Lawnview Ave
- 2804 Lowman St
- 2745 Share St
- 2809 Morton Dr
- 1011 Mount Joy St
- 330 Larchmont Ave
- 2730 E Main St
- 2702 Maplewood Ave
- 3617 Heatherwood Ave
- 465 Carillion Dr
- 375 N Fostoria Ave
Your Personal Tour Guide
Ask me questions while you tour the home.