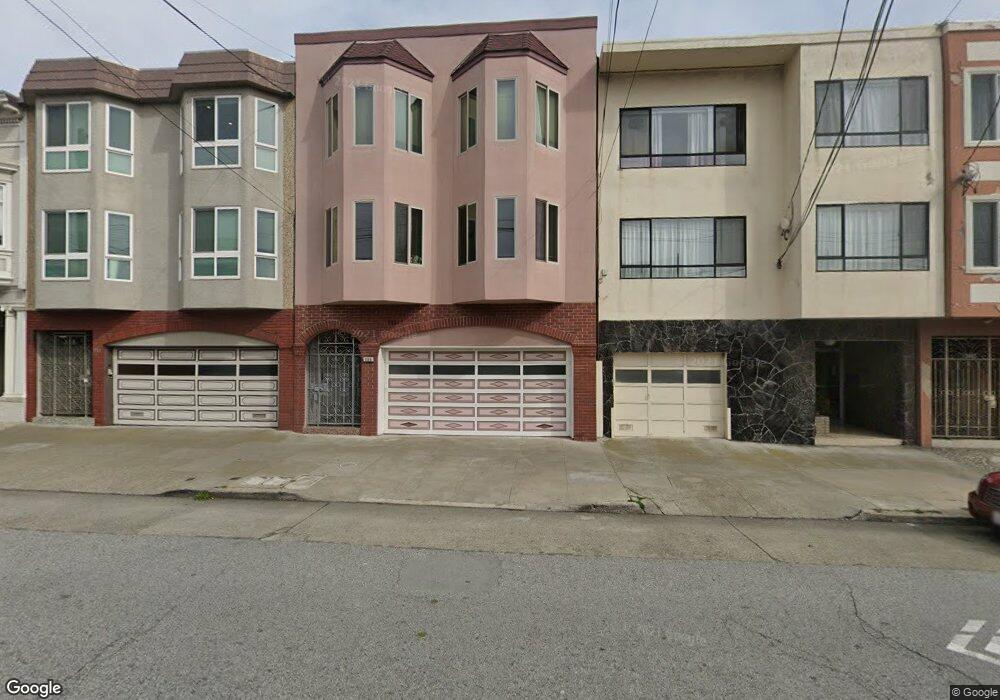
338 8th Ave San Francisco, CA 94118
Inner Richmond NeighborhoodEstimated Value: $2,082,000 - $2,260,000
8
Beds
7
Baths
4,284
Sq Ft
$503/Sq Ft
Est. Value
About This Home
This home is located at 338 8th Ave, San Francisco, CA 94118 and is currently estimated at $2,155,667, approximately $503 per square foot. 338 8th Ave is a home located in San Francisco County with nearby schools including George Peabody Elementary, Roosevelt Middle School, and Stratford School - San Francisco 14th Avenue.
Ownership History
Date
Name
Owned For
Owner Type
Purchase Details
Closed on
Nov 5, 2021
Sold by
Tang Colbert
Bought by
Tang Family Revocable Trust and Tang
Current Estimated Value
Purchase Details
Closed on
Oct 25, 2011
Sold by
Tang Rhoda and Tang Colbert
Bought by
Tang Rhoda and Tang Colbert
Purchase Details
Closed on
Jun 24, 2008
Sold by
Tang Aprielle
Bought by
Tang Aprielle
Purchase Details
Closed on
May 6, 1998
Sold by
Tang Colbert
Bought by
Tang Colbert
Purchase Details
Closed on
Aug 21, 1996
Sold by
Tang Alvin K and Tang Nora C
Bought by
Tang Aprielle and Tang Colbert
Create a Home Valuation Report for This Property
The Home Valuation Report is an in-depth analysis detailing your home's value as well as a comparison with similar homes in the area
Home Values in the Area
Average Home Value in this Area
Purchase History
| Date | Buyer | Sale Price | Title Company |
|---|---|---|---|
| Tang Family Revocable Trust | -- | None Listed On Document | |
| Tang Rhoda | -- | None Available | |
| Tang Aprielle | -- | None Available | |
| Tang Colbert | -- | -- | |
| Tang Aprielle | -- | -- |
Source: Public Records
Tax History Compared to Growth
Tax History
| Year | Tax Paid | Tax Assessment Tax Assessment Total Assessment is a certain percentage of the fair market value that is determined by local assessors to be the total taxable value of land and additions on the property. | Land | Improvement |
|---|---|---|---|---|
| 2025 | $13,686 | $1,133,560 | $523,955 | $609,605 |
| 2024 | $13,686 | $1,111,338 | $513,684 | $597,654 |
| 2023 | $13,359 | $1,089,553 | $503,615 | $585,938 |
| 2022 | $13,079 | $1,068,196 | $493,745 | $574,451 |
| 2021 | $12,860 | $1,047,256 | $484,067 | $563,189 |
| 2020 | $12,898 | $1,036,522 | $479,105 | $557,417 |
| 2019 | $12,468 | $1,016,204 | $469,714 | $546,490 |
| 2018 | $12,061 | $996,283 | $460,505 | $535,778 |
| 2017 | $11,924 | $976,749 | $451,476 | $525,273 |
| 2016 | $11,733 | $957,602 | $442,627 | $514,975 |
| 2015 | $11,595 | $943,225 | $435,983 | $507,242 |
| 2014 | $11,299 | $924,754 | $427,445 | $497,309 |
Source: Public Records
Map
Nearby Homes