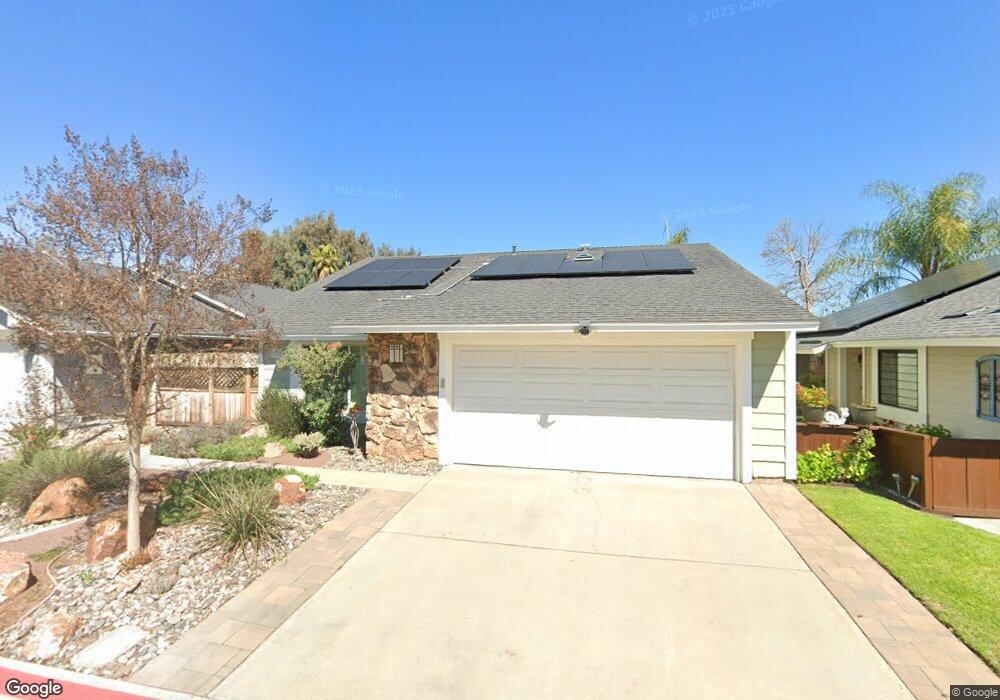
338 Sunflower Glen Escondido, CA 92026
North Broadway NeighborhoodEstimated Value: $557,000 - $691,000
2
Beds
2
Baths
1,090
Sq Ft
$584/Sq Ft
Est. Value
About This Home
This home is located at 338 Sunflower Glen, Escondido, CA 92026 and is currently estimated at $636,652, approximately $584 per square foot. 338 Sunflower Glen is a home located in San Diego County with nearby schools including North Broadway Elementary School, Rincon Middle School, and Escondido High School.
Ownership History
Date
Name
Owned For
Owner Type
Purchase Details
Closed on
Jul 12, 2024
Sold by
Green Eric
Bought by
Eric C Green 2024 Trust and Green
Current Estimated Value
Purchase Details
Closed on
Jun 13, 2024
Sold by
Kelly Barbara L
Bought by
Barbara L Kelly 2024 Trust and Kelly
Purchase Details
Closed on
Sep 8, 1996
Sold by
Hud
Bought by
Green Eric and Kelly Barbara
Home Financials for this Owner
Home Financials are based on the most recent Mortgage that was taken out on this home.
Original Mortgage
$117,178
Interest Rate
7.88%
Mortgage Type
FHA
Purchase Details
Closed on
Jan 25, 1996
Sold by
Norwest Mtg Inc
Bought by
Hud
Purchase Details
Closed on
Apr 19, 1991
Purchase Details
Closed on
Oct 21, 1988
Create a Home Valuation Report for This Property
The Home Valuation Report is an in-depth analysis detailing your home's value as well as a comparison with similar homes in the area
Home Values in the Area
Average Home Value in this Area
Purchase History
| Date | Buyer | Sale Price | Title Company |
|---|---|---|---|
| Eric C Green 2024 Trust | -- | None Listed On Document | |
| Barbara L Kelly 2024 Trust | -- | None Listed On Document | |
| Green Eric | $115,500 | California Coast Title | |
| Hud | -- | First American Title Ins Co | |
| Norwest Mtg Inc | $142,940 | First American Title Ins Co | |
| -- | $136,500 | -- | |
| -- | $104,900 | -- |
Source: Public Records
Mortgage History
| Date | Status | Borrower | Loan Amount |
|---|---|---|---|
| Previous Owner | Green Eric | $117,178 |
Source: Public Records
Tax History Compared to Growth
Tax History
| Year | Tax Paid | Tax Assessment Tax Assessment Total Assessment is a certain percentage of the fair market value that is determined by local assessors to be the total taxable value of land and additions on the property. | Land | Improvement |
|---|---|---|---|---|
| 2025 | $2,049 | $187,445 | $83,137 | $104,308 |
| 2024 | $2,049 | $183,770 | $81,507 | $102,263 |
| 2023 | $2,000 | $180,167 | $79,909 | $100,258 |
| 2022 | $1,977 | $176,636 | $78,343 | $98,293 |
| 2021 | $1,944 | $173,173 | $76,807 | $96,366 |
| 2020 | $1,932 | $171,398 | $76,020 | $95,378 |
| 2019 | $1,884 | $168,038 | $74,530 | $93,508 |
| 2018 | $1,831 | $164,744 | $73,069 | $91,675 |
| 2017 | $40 | $161,515 | $71,637 | $89,878 |
| 2016 | $1,763 | $158,349 | $70,233 | $88,116 |
| 2015 | $1,747 | $155,972 | $69,179 | $86,793 |
| 2014 | $1,674 | $152,917 | $67,824 | $85,093 |
Source: Public Records
Map
Nearby Homes
- 2153 Pleasantwood Ln
- 2250 N Broadway Unit 4
- 2250 N Broadway Unit 69
- 2085 Woolem Place
- 2096 Woolem Place
- 2086 Woolem Place
- 2066 Woolem Place
- 2257 Brookwood Ct
- 2035 Woolem Place
- Cardiff Plan at Capistrano
- Terramar Plan at Capistrano
- Grandview Plan at Capistrano
- 2046 Woolem Place
- 2208 Terracewood Ln
- 175 Double Eagle Glen Unit 1
- 228 Crestview Glen
- 2337 Douglaston Glen
- 2031 Wagon Wheel Ct
- 2001 Simpatico Place
- 530 Smoketree Glen
- 334 Sunflower Glen
- 342 Sunflower Glen
- 330 Sunflower Glen
- 337 Sunflower Glen
- 2141 Pleasantwood Ln
- 333 Sunflower Glen
- 341 Sunflower Glen
- 326 Sunflower Glen
- 329 Sunflower Glen
- 2151 Teal Glen
- 2145 Pleasantwood Ln
- 2147 Teal Glen
- 2138 Pleasantwood Ln
- 2143 Teal Glen
- 322 Sunflower Glen
- 2146 Pleasantwood Ln
- 336 Whippoorwill Glen
- 340 Whippoorwill Glen
- 332 Whippoorwill Glen
- 2139 Teal Glen