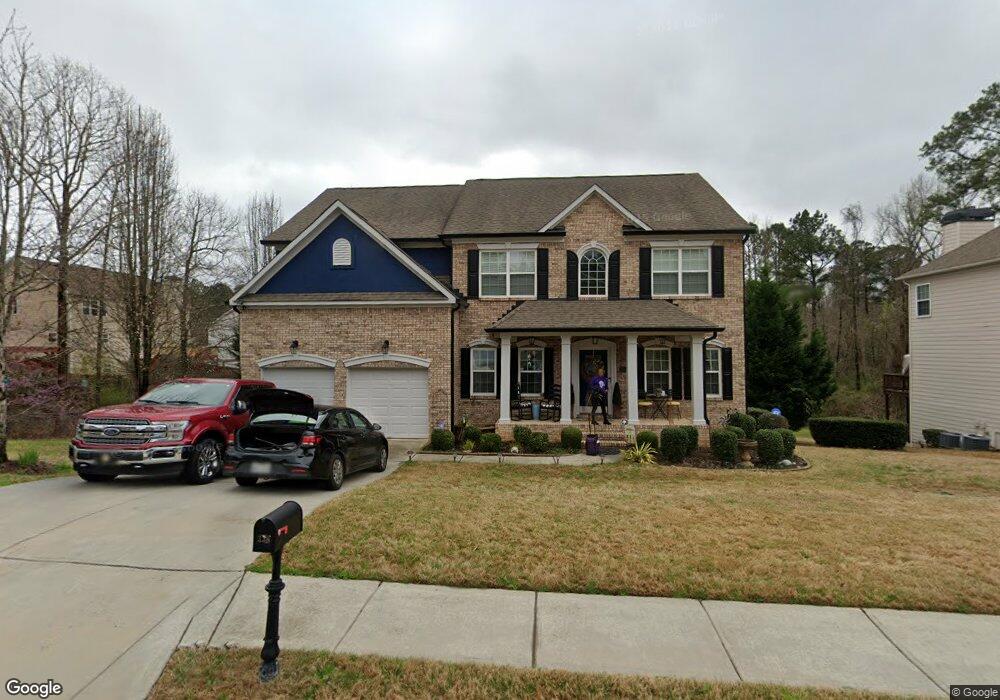
338 Viceroy Curve Stockbridge, GA 30281
Estimated Value: $409,000 - $451,000
5
Beds
3
Baths
3,024
Sq Ft
$142/Sq Ft
Est. Value
About This Home
This home is located at 338 Viceroy Curve, Stockbridge, GA 30281 and is currently estimated at $428,387, approximately $141 per square foot. 338 Viceroy Curve is a home located in Henry County with nearby schools including Red Oak Elementary School, Dutchtown Middle School, and Dutchtown High School.
Ownership History
Date
Name
Owned For
Owner Type
Purchase Details
Closed on
Jul 14, 2023
Sold by
Ocasio Bethzaida Rivera
Bought by
Luis Ocasio and Ocasio Bethzaida Rivera Trust
Current Estimated Value
Purchase Details
Closed on
Feb 17, 2021
Sold by
Ocasio Luis
Bought by
Ocasio Luis
Home Financials for this Owner
Home Financials are based on the most recent Mortgage that was taken out on this home.
Original Mortgage
$229,300
Interest Rate
2.7%
Mortgage Type
New Conventional
Purchase Details
Closed on
Jun 29, 2007
Sold by
Ryland Grp Inc
Bought by
Rivera Bethzaida and Ocasio Luis
Home Financials for this Owner
Home Financials are based on the most recent Mortgage that was taken out on this home.
Original Mortgage
$249,890
Interest Rate
6.37%
Mortgage Type
New Conventional
Create a Home Valuation Report for This Property
The Home Valuation Report is an in-depth analysis detailing your home's value as well as a comparison with similar homes in the area
Home Values in the Area
Average Home Value in this Area
Purchase History
| Date | Buyer | Sale Price | Title Company |
|---|---|---|---|
| Luis Ocasio | -- | -- | |
| Ocasio Luis | -- | -- | |
| Rivera Bethzaida | $312,400 | -- |
Source: Public Records
Mortgage History
| Date | Status | Borrower | Loan Amount |
|---|---|---|---|
| Previous Owner | Ocasio Luis | $229,300 | |
| Previous Owner | Rivera Bethzaida | $249,890 |
Source: Public Records
Tax History Compared to Growth
Tax History
| Year | Tax Paid | Tax Assessment Tax Assessment Total Assessment is a certain percentage of the fair market value that is determined by local assessors to be the total taxable value of land and additions on the property. | Land | Improvement |
|---|---|---|---|---|
| 2025 | $5,599 | $161,800 | $18,000 | $143,800 |
| 2024 | $5,599 | $164,240 | $18,000 | $146,240 |
| 2023 | $5,442 | $168,360 | $14,000 | $154,360 |
| 2022 | $4,944 | $144,160 | $14,000 | $130,160 |
| 2021 | $4,191 | $112,320 | $12,000 | $100,320 |
| 2020 | $4,041 | $106,000 | $10,000 | $96,000 |
| 2019 | $3,636 | $97,200 | $10,000 | $87,200 |
| 2018 | $3,631 | $97,040 | $10,000 | $87,040 |
| 2016 | $3,001 | $80,640 | $9,600 | $71,040 |
| 2015 | $3,045 | $79,760 | $7,200 | $72,560 |
| 2014 | $2,947 | $76,520 | $7,200 | $69,320 |
Source: Public Records
Map
Nearby Homes
- 591 Creek Valley Ct
- 3916 Champagne Dr
- 687 Pathwood Ln
- 266 Monarch Village Way
- 520 Monarch Lake Way
- 300 Monarch Village Way
- 602 Brookwater Dr
- 623 Brookwater Dr
- 719 Nightwind Way
- 540 Anglewood Trace
- 4025 Jamaica Dr
- 512 Chaucer Way Unit 1
- 213 Sunderland Way Unit 1
- 125 Oak Leaf Dr
- 1341 Kent Manor Unit 3
- 1653 Jersey Dr
- 9055 Kelly Ct
- 198 Broder Farms Dr
- 1545 Brangus Dr
- 336 Viceroy Curve
- 590 Creek Valley Ct
- 592 Creek Valley Ct
- 334 Viceroy Curve
- 594 Creek Valley Ct
- 331 Viceroy Curve
- 333 Viceroy Curve
- 329 Viceroy Curve
- 586 Creek Valley Ct
- 332 Viceroy Curve
- 596 Creek Valley Ct
- 584 Creek Valley Ct
- 325 Viceroy Curve
- 0 Creek Valley Ct Unit 7024244
- 0 Creek Valley Ct Unit 3174761
- 0 Creek Valley Ct Unit 8104049
- 0 Creek Valley Ct Unit 8072069
- 0 Creek Valley Ct Unit 7598628
- 0 Creek Valley Ct Unit 7517707
- 0 Creek Valley Ct Unit 3218359