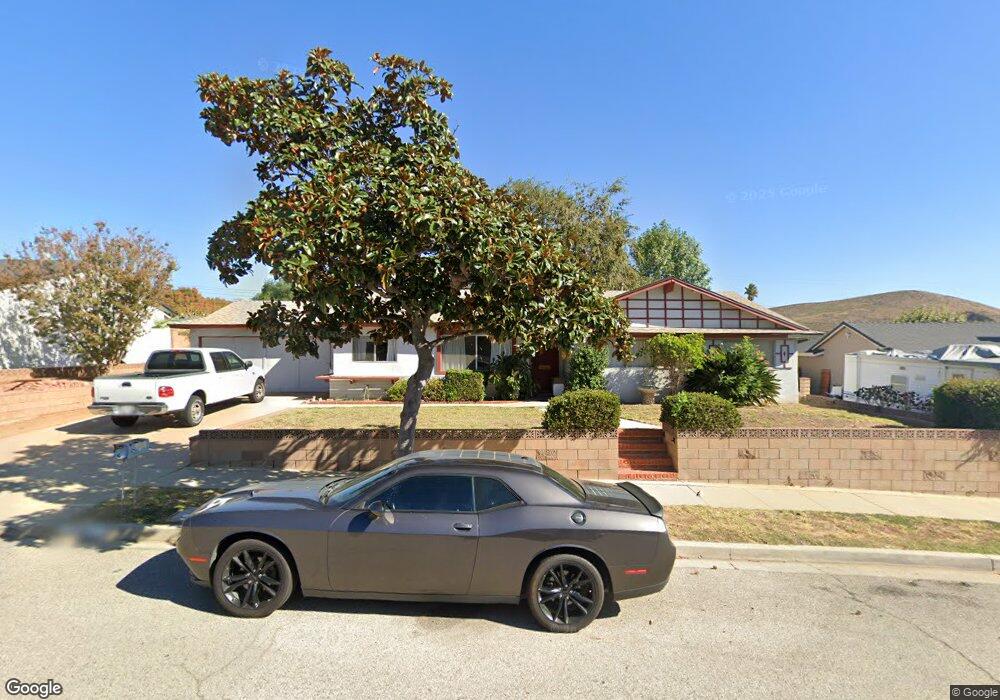
3384 Big Springs Ave Simi Valley, CA 93063
East Simi Valley NeighborhoodEstimated Value: $848,000 - $984,000
4
Beds
2
Baths
1,612
Sq Ft
$558/Sq Ft
Est. Value
About This Home
This home is located at 3384 Big Springs Ave, Simi Valley, CA 93063 and is currently estimated at $898,902, approximately $557 per square foot. 3384 Big Springs Ave is a home located in Ventura County with nearby schools including Big Springs Elementary School, Valley View Middle School, and Simi Valley High School.
Ownership History
Date
Name
Owned For
Owner Type
Purchase Details
Closed on
Feb 16, 2018
Sold by
Hancock Kevin A
Bought by
Hancock Kevin Allen and The Kevin Allen Hancock Trust
Current Estimated Value
Purchase Details
Closed on
Sep 29, 2010
Sold by
Hancock Kevin Allen
Bought by
Hancock Kevin A
Home Financials for this Owner
Home Financials are based on the most recent Mortgage that was taken out on this home.
Original Mortgage
$227,000
Outstanding Balance
$149,796
Interest Rate
4.35%
Mortgage Type
New Conventional
Estimated Equity
$749,106
Purchase Details
Closed on
Jul 28, 2005
Sold by
Hancock Carla Jean
Bought by
Hancock Kevin Allen
Purchase Details
Closed on
Jul 9, 1997
Sold by
The Richards Family Trust and Racine Denysse
Bought by
Hancock Kevin Allen and Hancock Carla Jean
Home Financials for this Owner
Home Financials are based on the most recent Mortgage that was taken out on this home.
Original Mortgage
$138,000
Interest Rate
7.45%
Mortgage Type
Seller Take Back
Create a Home Valuation Report for This Property
The Home Valuation Report is an in-depth analysis detailing your home's value as well as a comparison with similar homes in the area
Home Values in the Area
Average Home Value in this Area
Purchase History
| Date | Buyer | Sale Price | Title Company |
|---|---|---|---|
| Hancock Kevin Allen | -- | None Available | |
| Hancock Kevin A | -- | American Coast Title Company | |
| Hancock Kevin Allen | -- | -- | |
| Hancock Kevin Allen | $188,000 | Investors Title Company |
Source: Public Records
Mortgage History
| Date | Status | Borrower | Loan Amount |
|---|---|---|---|
| Open | Hancock Kevin A | $227,000 | |
| Closed | Hancock Kevin Allen | $138,000 |
Source: Public Records
Tax History Compared to Growth
Tax History
| Year | Tax Paid | Tax Assessment Tax Assessment Total Assessment is a certain percentage of the fair market value that is determined by local assessors to be the total taxable value of land and additions on the property. | Land | Improvement |
|---|---|---|---|---|
| 2025 | $3,807 | $287,382 | $114,949 | $172,433 |
| 2024 | $3,807 | $281,748 | $112,696 | $169,052 |
| 2023 | $3,577 | $276,224 | $110,486 | $165,738 |
| 2022 | $3,542 | $270,808 | $108,319 | $162,489 |
| 2021 | $3,498 | $265,499 | $106,196 | $159,303 |
| 2020 | $3,413 | $262,778 | $105,108 | $157,670 |
| 2019 | $3,255 | $257,627 | $103,048 | $154,579 |
| 2018 | $3,215 | $252,577 | $101,028 | $151,549 |
| 2017 | $3,134 | $247,626 | $99,048 | $148,578 |
| 2016 | $2,989 | $242,771 | $97,106 | $145,665 |
| 2015 | $2,917 | $239,127 | $95,649 | $143,478 |
| 2014 | $2,864 | $234,444 | $93,776 | $140,668 |
Source: Public Records
Map
Nearby Homes
- 4679 Summit Ave
- 4683 Summit Ave
- 4699 Summit Ave
- 4691 Summit Ave
- 4687 Summit Ave
- 3175 Corpus Christi St
- 3762 Prairie Ridge Ct
- 4984 Corral St
- 5019 Corral St
- 2945 Dalhart Ave
- 3194 Granville Ave
- 3005 Mineral Wells Dr
- 4676 Kleberg St
- 2948 Texas Ave
- 5206 Seneca Place
- 4508 Lubbock Dr Unit C
- 4553 Alamo St Unit F
- 3392 Big Springs Ave
- 3376 Big Springs Ave
- 3427 Wichita Falls Ave
- 3419 Wichita Falls Ave
- 3433 Wichita Falls Ave
- 4694 Fort Davis St
- 3406 Big Springs Ave
- 3397 Wichita Falls Ave
- 3368 Big Springs Ave
- 3445 Wichita Falls Ave
- 3369 Big Springs Ave
- 3393 Wichita Falls Ave
- 4688 Fort Davis St
- 3420 Big Springs Ave
- 3426 Wichita Falls Ave
- 3418 Wichita Falls Ave
- 3360 Big Springs Ave
- 3457 Wichita Falls Ave
- 3432 Wichita Falls Ave
- 3404 Wichita Falls Ave