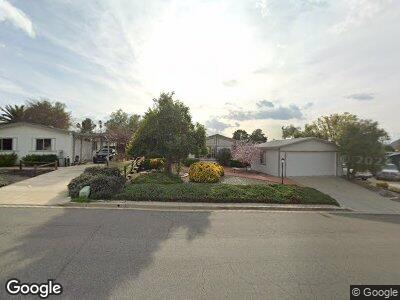
33885 Harvest Way Wildomar, CA 92595
Estimated Value: $560,158 - $604,000
4
Beds
2
Baths
1,997
Sq Ft
$292/Sq Ft
Est. Value
About This Home
This home is located at 33885 Harvest Way, Wildomar, CA 92595 and is currently estimated at $582,790, approximately $291 per square foot. 33885 Harvest Way is a home located in Riverside County with nearby schools including Ronald Reagan Elementary School, David A. Brown Middle School, and Elsinore High School.
Ownership History
Date
Name
Owned For
Owner Type
Purchase Details
Closed on
Feb 9, 2021
Sold by
Chapman Tracy Searles and Searles Tracy L
Bought by
Hibshman Toby Ray and Hibshman Kimberlie
Current Estimated Value
Home Financials for this Owner
Home Financials are based on the most recent Mortgage that was taken out on this home.
Original Mortgage
$200,000
Outstanding Balance
$181,713
Interest Rate
2.7%
Mortgage Type
New Conventional
Estimated Equity
$395,361
Purchase Details
Closed on
Jul 10, 2008
Sold by
U S Bank Na
Bought by
Searles Tracy L
Home Financials for this Owner
Home Financials are based on the most recent Mortgage that was taken out on this home.
Original Mortgage
$110,000
Interest Rate
6.41%
Mortgage Type
Purchase Money Mortgage
Purchase Details
Closed on
May 8, 2008
Sold by
Jimenez Micaela
Bought by
U S Bank Na and Lehman Brothers
Create a Home Valuation Report for This Property
The Home Valuation Report is an in-depth analysis detailing your home's value as well as a comparison with similar homes in the area
Home Values in the Area
Average Home Value in this Area
Purchase History
| Date | Buyer | Sale Price | Title Company |
|---|---|---|---|
| Hibshman Toby Ray | $250,000 | Ticor Title | |
| Searles Tracy L | $220,000 | Fnf Ie | |
| U S Bank Na | $169,600 | None Available |
Source: Public Records
Mortgage History
| Date | Status | Borrower | Loan Amount |
|---|---|---|---|
| Open | Hibshman Toby Ray | $200,000 | |
| Previous Owner | Searles Tracy L | $110,000 | |
| Previous Owner | Jimenez Micaela | $73,169 |
Source: Public Records
Tax History Compared to Growth
Tax History
| Year | Tax Paid | Tax Assessment Tax Assessment Total Assessment is a certain percentage of the fair market value that is determined by local assessors to be the total taxable value of land and additions on the property. | Land | Improvement |
|---|---|---|---|---|
| 2023 | $5,455 | $431,766 | $93,636 | $338,130 |
| 2022 | $5,309 | $423,300 | $91,800 | $331,500 |
| 2021 | $3,635 | $261,717 | $83,271 | $178,446 |
| 2020 | $3,607 | $259,035 | $82,418 | $176,617 |
| 2019 | $3,555 | $253,956 | $80,802 | $173,154 |
| 2018 | $3,503 | $248,977 | $79,218 | $169,759 |
| 2017 | $3,453 | $244,096 | $77,665 | $166,431 |
| 2016 | $3,358 | $239,311 | $76,143 | $163,168 |
| 2015 | $3,323 | $235,718 | $75,000 | $160,718 |
| 2014 | $3,244 | $231,103 | $73,532 | $157,571 |
Source: Public Records
Map
Nearby Homes
- 33805 Windmill Rd
- 33853 Plowshare Rd
- 33748 Windmill Rd
- 33828 Plowshare Rd
- 33991 Green Bean Ln
- 33908 Applecart Ct
- 24472 Cornstalk Rd
- 24853 Rainbarrel Rd
- 34252 Harrow Hill Rd
- 34264 Harrow Hill Rd
- 33778 The Farm Rd
- 24800 Cornstalk Rd
- 33421 Mill Pond Dr
- 33441 Furrow Ct
- 33680 Harvest Way E
- 33418 Furrow Ct
- 24040 Wheatfield Cir
- 24860 Split Rail Rd
- 34835 The Farm Rd
- 25195 Arcadia Ln
- 33885 Harvest Way
- 33879 Harvest Way
- 33901 Harvest Way
- 33871 Harvest Way
- 33956 Windmill Rd
- 33942 Windmill Rd
- 33966 Windmill Rd
- 33909 Harvest Way
- 33900 Harvest Way
- 33932 Windmill Rd
- 33978 Windmill Rd
- 33978 Windmill Rd Unit lot 65
- 24627 Buttermilk Cir
- 33910 Harvest Way
- 33855 Harvest Way
- 33917 Harvest Way
- 33922 Windmill Rd
- 33910 Windmill Rd
- 33925 Harvest Way
- 33836 Windmill Rd Unit 78