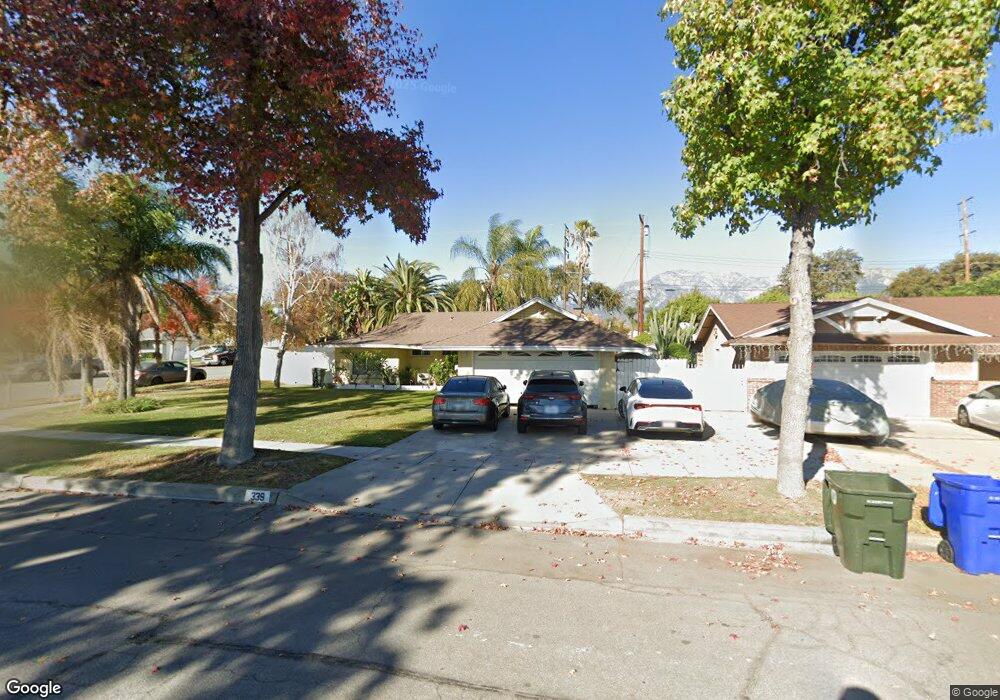
339 Azure Ct Upland, CA 91786
Estimated Value: $675,000 - $729,530
3
Beds
2
Baths
1,300
Sq Ft
$538/Sq Ft
Est. Value
About This Home
This home is located at 339 Azure Ct, Upland, CA 91786 and is currently estimated at $699,633, approximately $538 per square foot. 339 Azure Ct is a home located in San Bernardino County with nearby schools including Citrus Elementary, Upland Junior High School, and Upland High School.
Ownership History
Date
Name
Owned For
Owner Type
Purchase Details
Closed on
Apr 22, 1996
Sold by
Keller Walter R
Bought by
Keller Walter R and Keller Robin
Current Estimated Value
Home Financials for this Owner
Home Financials are based on the most recent Mortgage that was taken out on this home.
Original Mortgage
$128,700
Interest Rate
8.01%
Create a Home Valuation Report for This Property
The Home Valuation Report is an in-depth analysis detailing your home's value as well as a comparison with similar homes in the area
Home Values in the Area
Average Home Value in this Area
Purchase History
| Date | Buyer | Sale Price | Title Company |
|---|---|---|---|
| Keller Walter R | -- | Gateway Title Company | |
| Martinez Pete | $135,500 | Gateway Title Company |
Source: Public Records
Mortgage History
| Date | Status | Borrower | Loan Amount |
|---|---|---|---|
| Previous Owner | Martinez Pete | $128,700 |
Source: Public Records
Tax History
| Year | Tax Paid | Tax Assessment Tax Assessment Total Assessment is a certain percentage of the fair market value that is determined by local assessors to be the total taxable value of land and additions on the property. | Land | Improvement |
|---|---|---|---|---|
| 2025 | $2,499 | $220,686 | $76,549 | $144,137 |
| 2024 | $2,419 | $216,359 | $75,048 | $141,311 |
| 2023 | $2,380 | $212,116 | $73,576 | $138,540 |
| 2022 | $2,326 | $207,957 | $72,133 | $135,824 |
| 2021 | $2,319 | $203,880 | $70,719 | $133,161 |
| 2020 | $2,330 | $201,790 | $69,994 | $131,796 |
| 2019 | $9,707 | $197,834 | $68,622 | $129,212 |
| 2018 | $9,653 | $193,954 | $67,276 | $126,678 |
| 2017 | $9,548 | $190,151 | $65,957 | $124,194 |
| 2016 | $4,501 | $186,423 | $64,664 | $121,759 |
| 2015 | $4,465 | $183,623 | $63,693 | $119,930 |
| 2014 | $1,923 | $180,026 | $62,445 | $117,581 |
Source: Public Records
Map
Nearby Homes
- 1550 N Bonita Ct
- 340 W Caroline Ct
- 333 White Ave
- 296 S Laurel Ave
- 428 W 8th St
- 306 S Vallejo Way
- 345 Euclid Place
- 181 E 8th St
- 107 N 1st Ave
- 145 N 1st Ave
- 157 N 1st Ave
- 161 N 1st Ave
- 814 W Bonnie Brae Ct
- 435 W 9th St Unit B3
- 196 Eureka Place
- 144 Dorsett Ave
- 822 W 5th St
- 580 Katy Dr
- 595 Orlando Ct
- 858 W Yale St
Your Personal Tour Guide
Ask me questions while you tour the home.