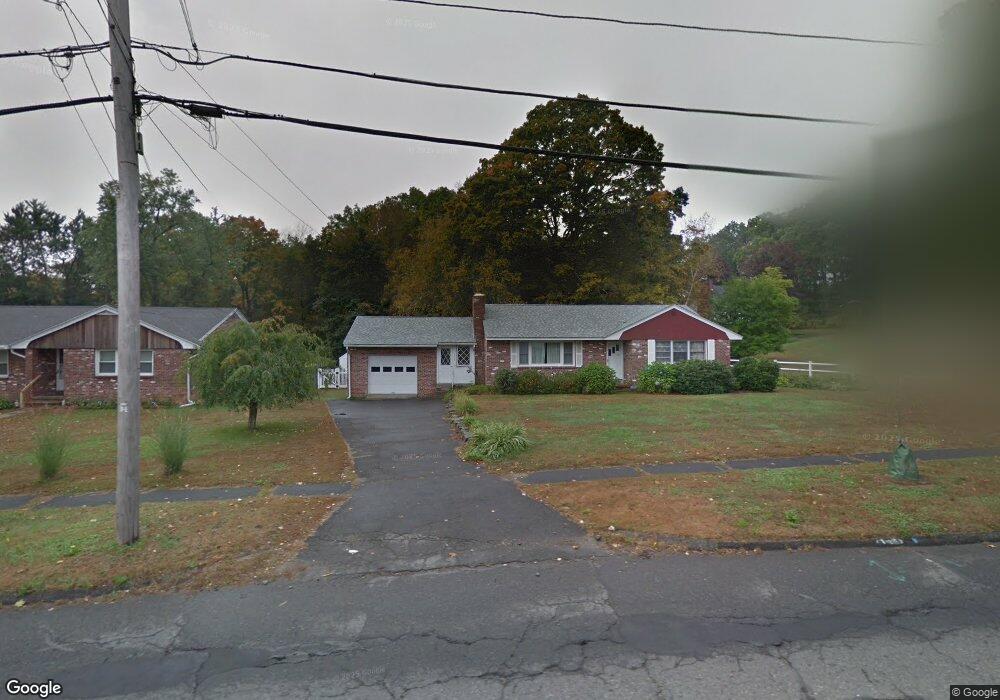
339 Bridge Rd Florence, MA 01062
Florence NeighborhoodEstimated Value: $454,000 - $562,000
3
Beds
2
Baths
1,461
Sq Ft
$343/Sq Ft
Est. Value
About This Home
This home is located at 339 Bridge Rd, Florence, MA 01062 and is currently estimated at $500,847, approximately $342 per square foot. 339 Bridge Rd is a home located in Hampshire County with nearby schools including Northampton High School, The Montessori School of Northampton, and Lander Grinspoon Academy.
Ownership History
Date
Name
Owned For
Owner Type
Purchase Details
Closed on
Sep 20, 2017
Sold by
Walsh Lillian R and Pedevillano Diane
Bought by
Walsh Katherine
Current Estimated Value
Home Financials for this Owner
Home Financials are based on the most recent Mortgage that was taken out on this home.
Original Mortgage
$179,360
Outstanding Balance
$148,335
Interest Rate
3.9%
Mortgage Type
New Conventional
Estimated Equity
$352,512
Purchase Details
Closed on
Jun 8, 2012
Sold by
Walsh Denis J and Walsh Lillian R
Bought by
Walsh Katherine and Pedevillano Diane
Create a Home Valuation Report for This Property
The Home Valuation Report is an in-depth analysis detailing your home's value as well as a comparison with similar homes in the area
Home Values in the Area
Average Home Value in this Area
Purchase History
| Date | Buyer | Sale Price | Title Company |
|---|---|---|---|
| Walsh Katherine | $179,360 | -- | |
| Walsh Katherine | -- | -- |
Source: Public Records
Mortgage History
| Date | Status | Borrower | Loan Amount |
|---|---|---|---|
| Open | Walsh Katherine | $179,360 |
Source: Public Records
Tax History
| Year | Tax Paid | Tax Assessment Tax Assessment Total Assessment is a certain percentage of the fair market value that is determined by local assessors to be the total taxable value of land and additions on the property. | Land | Improvement |
|---|---|---|---|---|
| 2025 | $5,778 | $414,800 | $123,500 | $291,300 |
| 2024 | $5,505 | $362,400 | $123,500 | $238,900 |
| 2023 | $4,480 | $282,800 | $112,200 | $170,600 |
| 2022 | $4,651 | $260,000 | $112,200 | $147,800 |
| 2021 | $4,443 | $255,800 | $107,200 | $148,600 |
| 2020 | $4,297 | $255,800 | $107,200 | $148,600 |
| 2019 | $3,978 | $229,000 | $92,200 | $136,800 |
| 2018 | $3,820 | $224,200 | $92,200 | $132,000 |
| 2017 | $3,742 | $224,200 | $92,200 | $132,000 |
| 2016 | $3,623 | $224,200 | $92,200 | $132,000 |
| 2015 | $3,593 | $227,400 | $92,200 | $135,200 |
| 2014 | $3,500 | $227,400 | $92,200 | $135,200 |
Source: Public Records
Map
Nearby Homes
- 44 Sheffield Ln
- 575 Bridge Rd Unit 12-7
- 575 Bridge Rd Unit 10-5
- 76 Maple St
- 2 Juniper Place
- 67 Park St Unit A
- 0 Terrace Ln
- 37 Landy Ave
- 88 Pines Edge Dr Unit 88
- 289 Hatfield St
- 32 Stonewall Dr
- 63 Riverside Dr
- 42 Clark St
- 61 Woodlawn Ave
- 80 Damon Rd Unit 5104
- 80 Damon Rd Unit 4302
- 0 Haydenville Rd
- 48 Evergreen Rd Unit 306
- 44 Evergreen Rd Unit 302
- 218 Elm St
- 347 Bridge Rd
- 8 Fox Farms Rd
- 20 Fox Farms Rd
- 264 Chestnut St
- 256 Chestnut St
- 28 Fox Farms Rd
- 340 Bridge Rd
- 330 Bridge Rd
- 246 Chestnut St
- 11 Fox Farms Rd
- 389 Bridge Rd
- 315 Bridge Rd
- 19 Fox Farms Rd
- 44 Fox Farms Rd
- 27 Fox Farms Rd
- 373 Bridge Rd
- 253 Chestnut St
- 245 Chestnut St
- 320 Bridge Rd
- 305 Bridge Rd
Your Personal Tour Guide
Ask me questions while you tour the home.