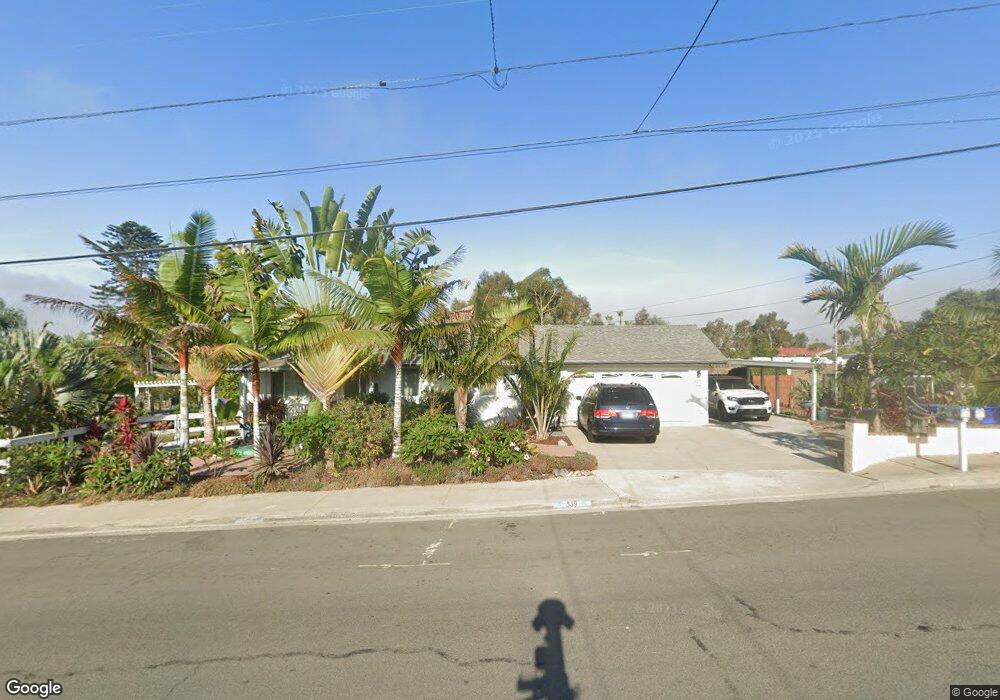
339 Crouch St Oceanside, CA 92054
Loma Alta NeighborhoodEstimated Value: $934,466 - $1,331,000
Studio
--
Bath
2,244
Sq Ft
$510/Sq Ft
Est. Value
About This Home
This home is located at 339 Crouch St, Oceanside, CA 92054 and is currently estimated at $1,144,617, approximately $510 per square foot. 339 Crouch St is a home located in San Diego County with nearby schools including Mission Elementary School, Lincoln Middle School, and Oceanside High School.
Ownership History
Date
Name
Owned For
Owner Type
Purchase Details
Closed on
Jul 15, 2021
Sold by
Russell Nina and The Nina Russell Real Property
Bought by
Russell Nina and The Nina Russell Living Trust
Current Estimated Value
Purchase Details
Closed on
Feb 4, 2021
Sold by
Varlie Judith M and The Flores Family Survivors Tr
Bought by
Russell Nina and The Nina Russell Real Property
Purchase Details
Closed on
May 26, 2020
Sold by
Varlie Judith M and The Flores Family Trust
Bought by
Varlie Judith M and The Flores Family Survivors Tr
Purchase Details
Closed on
May 18, 1994
Sold by
Flores Jose L and Flores Judith M
Bought by
Flores Jose Luis and Flores Judith Marie
Create a Home Valuation Report for This Property
The Home Valuation Report is an in-depth analysis detailing your home's value as well as a comparison with similar homes in the area
Home Values in the Area
Average Home Value in this Area
Purchase History
| Date | Buyer | Sale Price | Title Company |
|---|---|---|---|
| Russell Nina | -- | None Available | |
| Russell Nina | -- | None Available | |
| Varlie Judith M | -- | None Available | |
| Flores Jose Luis | -- | -- | |
| Flores Jose L | -- | -- |
Source: Public Records
Tax History
| Year | Tax Paid | Tax Assessment Tax Assessment Total Assessment is a certain percentage of the fair market value that is determined by local assessors to be the total taxable value of land and additions on the property. | Land | Improvement |
|---|---|---|---|---|
| 2025 | $834 | $69,881 | $16,086 | $53,795 |
| 2024 | $834 | $68,512 | $15,771 | $52,741 |
| 2023 | $808 | $67,169 | $15,462 | $51,707 |
| 2022 | $796 | $65,853 | $15,159 | $50,694 |
| 2021 | $799 | $64,562 | $14,862 | $49,700 |
| 2020 | $776 | $63,901 | $14,710 | $49,191 |
| 2019 | $756 | $62,649 | $14,422 | $48,227 |
| 2018 | $748 | $61,422 | $14,140 | $47,282 |
| 2017 | $70 | $60,218 | $13,863 | $46,355 |
| 2016 | $711 | $59,039 | $13,592 | $45,447 |
| 2015 | $691 | $58,153 | $13,388 | $44,765 |
| 2014 | $668 | $57,015 | $13,126 | $43,889 |
Source: Public Records
Map
Nearby Homes
- 230 Hoover St
- 506 Canyon Dr Unit 6
- 506 Canyon Dr Unit 85
- 116 N Barnwell St
- 2245 Hilldale St
- 519 Camelot Dr
- 306 Fowles St
- 2713 Lancelot Dr
- 1786 Jasmine Way
- 2306 Loker Way
- 2308 Loker Way
- 2312 Loker Way
- 2309 Loker Way
- 223 Cottingham Ct
- 1535 Molly Cir
- 2311 Loker Way
- 1331 Cornish Dr
- 432 Edgehill Ln Unit 169
- 432 Edgehill Ln Unit 165
- 432 Edgehill Ln Unit 83
Your Personal Tour Guide
Ask me questions while you tour the home.