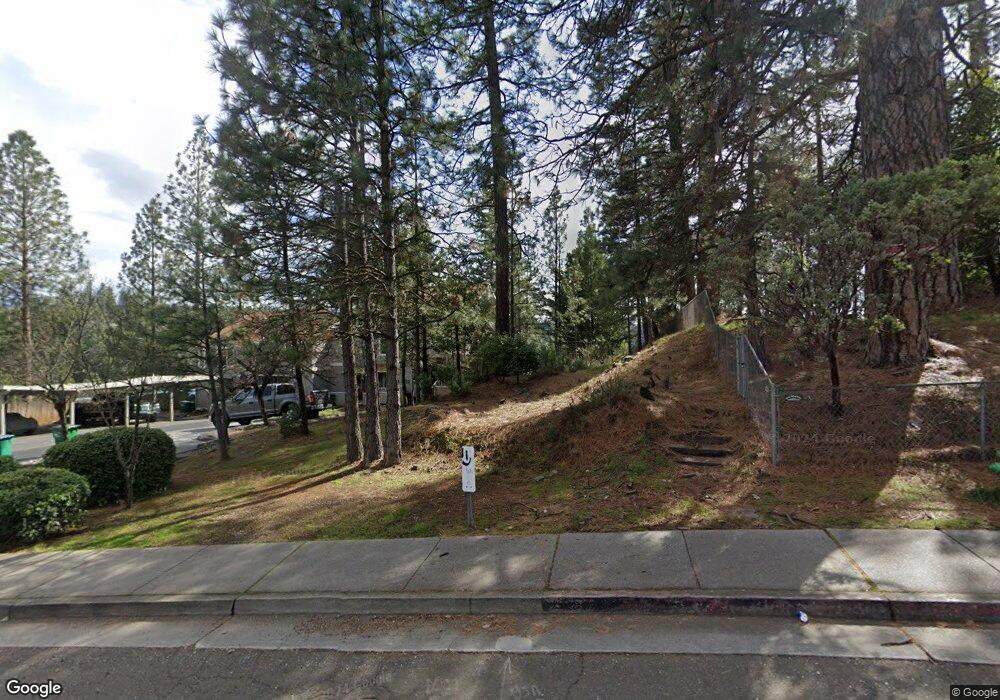
339 Dorsey Dr Grass Valley, CA 95945
Estimated Value: $302,000 - $368,000
3
Beds
3
Baths
1,516
Sq Ft
$217/Sq Ft
Est. Value
About This Home
This home is located at 339 Dorsey Dr, Grass Valley, CA 95945 and is currently estimated at $329,557, approximately $217 per square foot. 339 Dorsey Dr is a home located in Nevada County with nearby schools including Bell Hill Academy, Margaret G. Scotten Elementary School, and Lyman Gilmore Middle School.
Ownership History
Date
Name
Owned For
Owner Type
Purchase Details
Closed on
Mar 18, 1998
Sold by
Radford James E
Bought by
Coburn George William
Current Estimated Value
Home Financials for this Owner
Home Financials are based on the most recent Mortgage that was taken out on this home.
Original Mortgage
$76,800
Outstanding Balance
$14,050
Interest Rate
7.02%
Estimated Equity
$315,507
Create a Home Valuation Report for This Property
The Home Valuation Report is an in-depth analysis detailing your home's value as well as a comparison with similar homes in the area
Home Values in the Area
Average Home Value in this Area
Purchase History
| Date | Buyer | Sale Price | Title Company |
|---|---|---|---|
| Coburn George William | $96,000 | Placer Title Company |
Source: Public Records
Mortgage History
| Date | Status | Borrower | Loan Amount |
|---|---|---|---|
| Open | Coburn George William | $76,800 | |
| Closed | Coburn George William | $10,000 |
Source: Public Records
Tax History Compared to Growth
Tax History
| Year | Tax Paid | Tax Assessment Tax Assessment Total Assessment is a certain percentage of the fair market value that is determined by local assessors to be the total taxable value of land and additions on the property. | Land | Improvement |
|---|---|---|---|---|
| 2025 | $1,622 | $153,257 | $47,884 | $105,373 |
| 2024 | $1,583 | $150,253 | $46,946 | $103,307 |
| 2023 | $1,583 | $147,308 | $46,026 | $101,282 |
| 2022 | $1,567 | $144,421 | $45,124 | $99,297 |
| 2021 | $1,514 | $141,590 | $44,240 | $97,350 |
| 2020 | $1,512 | $140,139 | $43,787 | $96,352 |
| 2019 | $1,450 | $137,392 | $42,929 | $94,463 |
| 2018 | $1,442 | $134,699 | $42,088 | $92,611 |
| 2017 | $1,385 | $132,059 | $41,263 | $90,796 |
| 2016 | $1,334 | $129,470 | $40,454 | $89,016 |
| 2015 | $1,315 | $127,526 | $39,847 | $87,679 |
| 2014 | $1,315 | $125,029 | $39,067 | $85,962 |
Source: Public Records
Map
Nearby Homes
- 1576 Mulberry Dr
- 1517 Mulberry Dr
- 987 Pampas Dr
- 975 Amber Loop
- 319 Shamrock Dr
- 1025 Amber Loop
- 315 Shamrock Dr
- 318 Shamrock Dr
- 311 Shamrock Dr
- 314 Shamrock Dr
- 307 Shamrock Dr
- 310 Shamrock Dr
- 303 Shamrock Dr
- 970 Laurel Ln
- 222 Shamrock Dr
- 136 Jackrabbit Rd
- 114 Jackrabbit Rd
- 118 Jackrabbit Rd
- 106 Jackrabbit Rd
- 110 Jackrabbit Rd