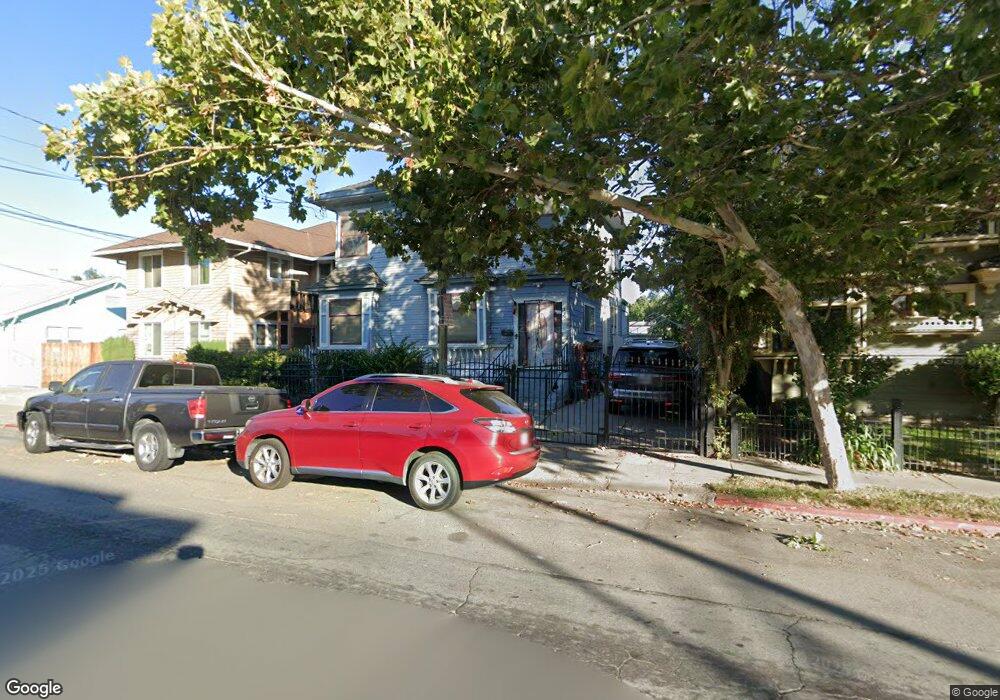
339 E Saint James St San Jose, CA 95112
Northside NeighborhoodEstimated Value: $1,096,000 - $1,470,110
4
Beds
2
Baths
1,920
Sq Ft
$681/Sq Ft
Est. Value
About This Home
This home is located at 339 E Saint James St, San Jose, CA 95112 and is currently estimated at $1,307,278, approximately $680 per square foot. 339 E Saint James St is a home located in Santa Clara County with nearby schools including Horace Mann Elementary School, Muwekma Ohlone Middle, and San Jose High School.
Ownership History
Date
Name
Owned For
Owner Type
Purchase Details
Closed on
Sep 28, 2007
Sold by
Moreno Cecilia F and Perez Rosie
Bought by
Moreno Cecilia F
Current Estimated Value
Home Financials for this Owner
Home Financials are based on the most recent Mortgage that was taken out on this home.
Original Mortgage
$585,000
Outstanding Balance
$373,016
Interest Rate
6.62%
Mortgage Type
Purchase Money Mortgage
Estimated Equity
$934,262
Purchase Details
Closed on
May 12, 2005
Sold by
Clark Charles L and Clark Angela E
Bought by
Moreno Cecilia F and Perez Rosie
Home Financials for this Owner
Home Financials are based on the most recent Mortgage that was taken out on this home.
Original Mortgage
$559,695
Interest Rate
6.5%
Mortgage Type
Purchase Money Mortgage
Purchase Details
Closed on
Apr 30, 2002
Sold by
Blair Donald W and Blair Deanna L
Bought by
Clark Charles L and Clark Angela E
Home Financials for this Owner
Home Financials are based on the most recent Mortgage that was taken out on this home.
Original Mortgage
$425,600
Interest Rate
7.18%
Purchase Details
Closed on
May 7, 1998
Sold by
Blair Donald W and Blair Deanna L
Bought by
Blair Donald W and Blair Deanna L
Create a Home Valuation Report for This Property
The Home Valuation Report is an in-depth analysis detailing your home's value as well as a comparison with similar homes in the area
Home Values in the Area
Average Home Value in this Area
Purchase History
| Date | Buyer | Sale Price | Title Company |
|---|---|---|---|
| Moreno Cecilia F | -- | Financial Title Company | |
| Moreno Cecilia F | $700,000 | Chicago Title | |
| Clark Charles L | $532,000 | Chicago Title Co | |
| Blair Donald W | -- | -- |
Source: Public Records
Mortgage History
| Date | Status | Borrower | Loan Amount |
|---|---|---|---|
| Open | Moreno Cecilia F | $585,000 | |
| Previous Owner | Moreno Cecilia F | $559,695 | |
| Previous Owner | Clark Charles L | $425,600 |
Source: Public Records
Tax History
| Year | Tax Paid | Tax Assessment Tax Assessment Total Assessment is a certain percentage of the fair market value that is determined by local assessors to be the total taxable value of land and additions on the property. | Land | Improvement |
|---|---|---|---|---|
| 2025 | $11,872 | $921,307 | $599,511 | $321,796 |
| 2024 | $11,872 | $903,243 | $587,756 | $315,487 |
| 2023 | $11,642 | $885,533 | $576,232 | $309,301 |
| 2022 | $11,541 | $868,171 | $564,934 | $303,237 |
| 2021 | $11,300 | $851,149 | $553,857 | $297,292 |
| 2020 | $11,042 | $842,422 | $548,178 | $294,244 |
| 2019 | $10,804 | $825,905 | $537,430 | $288,475 |
| 2018 | $10,695 | $809,712 | $526,893 | $282,819 |
| 2017 | $10,607 | $793,836 | $516,562 | $277,274 |
| 2016 | $10,420 | $778,272 | $506,434 | $271,838 |
| 2015 | $11,393 | $766,582 | $498,827 | $267,755 |
| 2014 | $10,772 | $751,567 | $489,056 | $262,511 |
Source: Public Records
Map
Nearby Homes
- 417 E Saint James St
- 431 E Saint John St
- 362 N 7th St
- 309 N 5th St
- 623 & 625 S 2nd St
- 333 & 335 N 4th St
- 361 N 10th St
- 436 N 7th St
- 97 E Saint James St Unit 21
- 97 E Saint James St Unit 26
- 350 N 2nd St Unit 323
- 30 E Julian St Unit 307
- 401 N 13th St
- 436 N 12th St
- 1 E Julian St Unit 113
- 305 E Empire St
- 25 S 3rd St Unit 118
- 915 E Julian St
- 400 N 1st St Unit 111
- 415 N 2nd St Unit 245
- 349 E Saint James St
- 329 E Saint James St
- 329 E Saint James St Unit 329
- 325 E Saint James St
- 231 N 8th St
- 323 E Saint James St Unit A
- 323 E Saint James St
- 232 N 7th St
- 321 E Saint James St
- 234 N 7th St
- 340 E Saint James St
- 236 N 7th St
- 351 E Saint James St
- 237 N 8th St Unit 4
- 237 N 8th St Unit 3
- 237 N 8th St Unit 2
- 330 E Saint James St
- 322 E Saint James St
- 238 N 7th St
- 247 N 8th St Unit 3
Your Personal Tour Guide
Ask me questions while you tour the home.