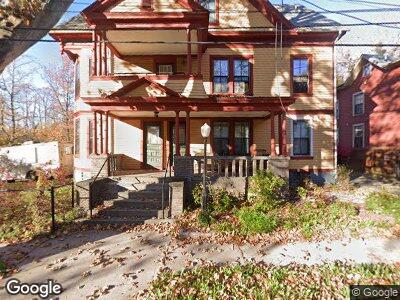
339 W Division St New Haven, CT 06511
Newhallville NeighborhoodEstimated Value: $397,000 - $473,000
6
Beds
2
Baths
3,450
Sq Ft
$128/Sq Ft
Est. Value
About This Home
This home is located at 339 W Division St, New Haven, CT 06511 and is currently estimated at $441,723, approximately $128 per square foot. 339 W Division St is a home located in New Haven County with nearby schools including Highville Charter School and St Thomas's Day School.
Ownership History
Date
Name
Owned For
Owner Type
Purchase Details
Closed on
Apr 5, 2012
Sold by
Neighborhood Housing S
Bought by
Chambers Lillieadair
Current Estimated Value
Home Financials for this Owner
Home Financials are based on the most recent Mortgage that was taken out on this home.
Original Mortgage
$183,820
Outstanding Balance
$128,270
Interest Rate
3.75%
Mortgage Type
FHA
Estimated Equity
$313,453
Purchase Details
Closed on
Feb 22, 2010
Sold by
Fnma
Bought by
Nbrhd Housing Inc
Purchase Details
Closed on
Aug 17, 2009
Sold by
Hsbc Bank Usa
Bought by
Federal National Mortgage Association
Purchase Details
Closed on
Aug 7, 2009
Sold by
Jones Ronald
Bought by
Hsbc Bank Usa
Purchase Details
Closed on
Nov 16, 2007
Sold by
Bracey Dean
Bought by
Jones Ronald
Purchase Details
Closed on
Feb 15, 2005
Sold by
Scudder David W
Bought by
Bracey Dean
Create a Home Valuation Report for This Property
The Home Valuation Report is an in-depth analysis detailing your home's value as well as a comparison with similar homes in the area
Home Values in the Area
Average Home Value in this Area
Purchase History
| Date | Buyer | Sale Price | Title Company |
|---|---|---|---|
| Chambers Lillieadair | $195,000 | -- | |
| Nbrhd Housing Inc | $45,000 | -- | |
| Federal National Mortgage Association | -- | -- | |
| Hsbc Bank Usa | -- | -- | |
| Jones Ronald | $265,000 | -- | |
| Bracey Dean | $170,000 | -- |
Source: Public Records
Mortgage History
| Date | Status | Borrower | Loan Amount |
|---|---|---|---|
| Open | Bracey Dean | $183,820 | |
| Closed | Bracey Dean | $10,000 |
Source: Public Records
Tax History Compared to Growth
Tax History
| Year | Tax Paid | Tax Assessment Tax Assessment Total Assessment is a certain percentage of the fair market value that is determined by local assessors to be the total taxable value of land and additions on the property. | Land | Improvement |
|---|---|---|---|---|
| 2024 | $9,473 | $246,050 | $34,720 | $211,330 |
| 2023 | $9,153 | $246,050 | $34,720 | $211,330 |
| 2022 | $9,780 | $246,050 | $34,720 | $211,330 |
| 2021 | $6,119 | $139,440 | $27,720 | $111,720 |
| 2020 | $6,119 | $139,440 | $27,720 | $111,720 |
| 2019 | $5,993 | $139,440 | $27,720 | $111,720 |
| 2018 | $5,993 | $139,440 | $27,720 | $111,720 |
| 2017 | $5,394 | $139,440 | $27,720 | $111,720 |
| 2016 | $4,435 | $106,750 | $12,320 | $94,430 |
| 2015 | $4,435 | $106,750 | $12,320 | $94,430 |
| 2014 | $4,435 | $106,750 | $12,320 | $94,430 |
Source: Public Records
Map
Nearby Homes
- 339 W Division St
- 36 Harding Place
- 335 W Division St
- 331 W Division St
- 32 Harding Place
- 40 Harding Place
- 40 Harding Place Unit 2
- 327 W Division St
- 340 W Division St
- 28 Harding Place
- 28 Harding Place Unit 3
- 28 Harding Place Unit 2
- 28 Harding Place Unit 1
- 336 W Division St
- 330 W Division St
- 24 Harding Place
- 325 W Division St
- 324 W Division St
- 319 W Division St
- 20 Harding Place