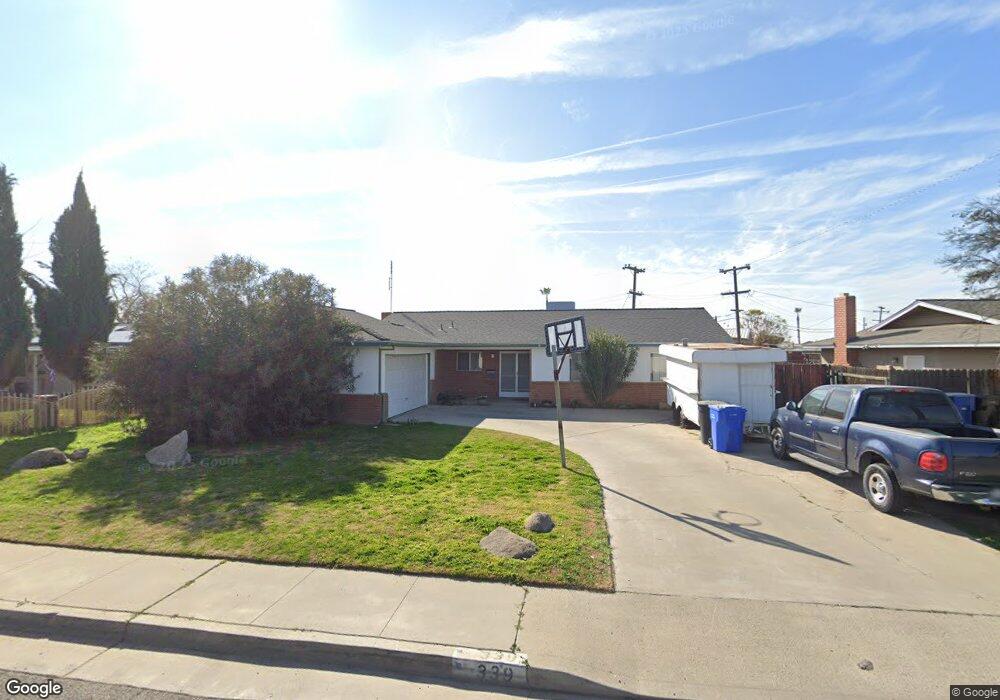
339 W Spring Ln Lemoore, CA 93245
Estimated Value: $351,819 - $378,000
3
Beds
2
Baths
1,729
Sq Ft
$208/Sq Ft
Est. Value
About This Home
This home is located at 339 W Spring Ln, Lemoore, CA 93245 and is currently estimated at $360,205, approximately $208 per square foot. 339 W Spring Ln is a home located in Kings County with nearby schools including Meadow Lane Elementary School, Liberty Middle School, and Lemoore High School.
Ownership History
Date
Name
Owned For
Owner Type
Purchase Details
Closed on
Dec 11, 2024
Sold by
Darlene Neal Revocable Trust and Darlene Neal Bypass Trust
Bought by
Signature Acquisitions Llc
Current Estimated Value
Home Financials for this Owner
Home Financials are based on the most recent Mortgage that was taken out on this home.
Original Mortgage
$1,122,000
Outstanding Balance
$1,111,153
Interest Rate
6.79%
Mortgage Type
New Conventional
Estimated Equity
-$750,948
Purchase Details
Closed on
Aug 23, 2017
Sold by
Neal Darlene
Bought by
Neal Darlene and Neal Lorenzo
Purchase Details
Closed on
Sep 22, 2000
Sold by
Hud
Bought by
Neal Glen and Neal Darlene
Purchase Details
Closed on
Feb 10, 2000
Sold by
Norwest Mtg Inc
Bought by
Hud
Purchase Details
Closed on
Nov 18, 1999
Sold by
Garza Ignacio and Garza April L
Bought by
Norwest Mtg Inc
Create a Home Valuation Report for This Property
The Home Valuation Report is an in-depth analysis detailing your home's value as well as a comparison with similar homes in the area
Home Values in the Area
Average Home Value in this Area
Purchase History
| Date | Buyer | Sale Price | Title Company |
|---|---|---|---|
| Signature Acquisitions Llc | $1,725,000 | Chicago Title Company | |
| Signature Acquisitions Llc | $1,725,000 | Chicago Title Company | |
| Neal Darlene | -- | None Available | |
| Neal Glen | $70,000 | Chicago Title Insurance Co | |
| Hud | -- | First American Title Ins Co | |
| Norwest Mtg Inc | $100,819 | First American Title Ins Co |
Source: Public Records
Mortgage History
| Date | Status | Borrower | Loan Amount |
|---|---|---|---|
| Open | Signature Acquisitions Llc | $1,122,000 | |
| Closed | Signature Acquisitions Llc | $1,122,000 |
Source: Public Records
Tax History
| Year | Tax Paid | Tax Assessment Tax Assessment Total Assessment is a certain percentage of the fair market value that is determined by local assessors to be the total taxable value of land and additions on the property. | Land | Improvement |
|---|---|---|---|---|
| 2025 | $1,070 | $340,000 | $85,000 | $255,000 |
| 2023 | $1,070 | $101,382 | $33,311 | $68,071 |
| 2022 | $1,123 | $99,395 | $32,658 | $66,737 |
| 2021 | $1,095 | $97,447 | $32,018 | $65,429 |
| 2020 | $1,089 | $96,448 | $31,690 | $64,758 |
| 2019 | $1,080 | $94,557 | $31,069 | $63,488 |
| 2018 | $1,015 | $92,703 | $30,460 | $62,243 |
| 2017 | $1,017 | $90,886 | $29,863 | $61,023 |
| 2016 | $957 | $89,103 | $29,277 | $59,826 |
| 2015 | $953 | $87,764 | $28,837 | $58,927 |
| 2014 | $925 | $86,045 | $28,272 | $57,773 |
Source: Public Records
Map
Nearby Homes
- 272 W Burlwood Ln
- 1150 Fire Fall Ave
- 422 W Spring Ln
- 636 Castellina St
- 217 W Hazelwood Dr
- 701 Strada St
- 5 W Spring Ln
- 137 W Spruce Ave
- 315 W Glendale Ave
- 237 W Glendale Ave
- 125 W Deodar Ln
- 952 Scotland St
- 108 W Deodar Ln
- 1504 Quartz Ave
- 1505 Quartz Ave
- 1528 Quartz Ave
- 1542 Quartz Ave
- 1513 Quartz Ave
- 1523 Quartz Ave
- 1475 Quandt Dr
- 327 W Spring Ln
- 351 W Spring Ln
- 315 W Spring Ln
- 371 W Spring Ln
- 332 W Spring Ln
- 342 W Spring Ln
- 0 D St
- 354 W Spring Ln
- 324 W Spring Ln
- 303 W Spring Ln
- 324 Spring Place
- 366 W Spring Ln
- 379 W Spring Ln
- 378 W Spring Ln
- 316 Spring Place
- 299 W Spring Ln
- 321 W Burlwood Ln
- 309 W Burlwood Ln
- 384 W Spring Ln
- 295 W Burlwood Ln
Your Personal Tour Guide
Ask me questions while you tour the home.