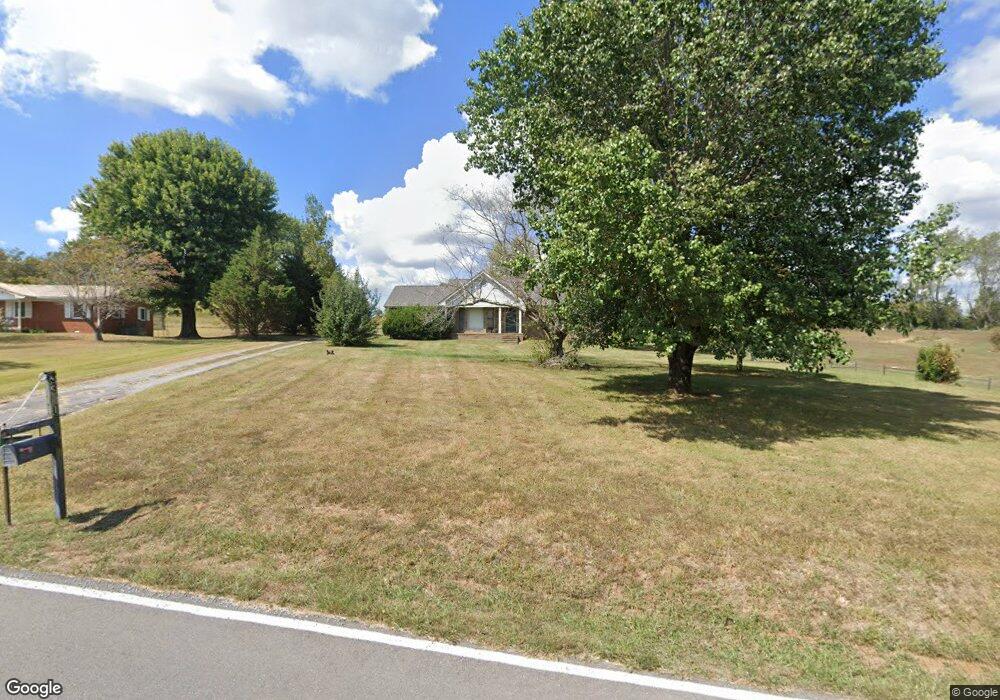
3390 Possum Trot Rd Greenbrier, TN 37073
Estimated Value: $317,000 - $365,000
--
Bed
2
Baths
1,393
Sq Ft
$244/Sq Ft
Est. Value
About This Home
This home is located at 3390 Possum Trot Rd, Greenbrier, TN 37073 and is currently estimated at $340,286, approximately $244 per square foot. 3390 Possum Trot Rd is a home located in Robertson County with nearby schools including Greenbrier Elementary School, Greenbrier Middle School, and Greenbrier High School.
Ownership History
Date
Name
Owned For
Owner Type
Purchase Details
Closed on
Jan 4, 2016
Sold by
Hale James M
Bought by
Johnson Keisha L
Current Estimated Value
Home Financials for this Owner
Home Financials are based on the most recent Mortgage that was taken out on this home.
Original Mortgage
$123,393
Outstanding Balance
$98,137
Interest Rate
3.96%
Mortgage Type
New Conventional
Estimated Equity
$242,149
Purchase Details
Closed on
Sep 16, 2015
Sold by
Bank Of America Na
Bought by
Hale James M
Purchase Details
Closed on
Jul 27, 2015
Sold by
Waynick Roger L
Bought by
Bank Of America Na
Purchase Details
Closed on
Jul 28, 2006
Bought by
Waynick Roger L and Waynick Michelle
Home Financials for this Owner
Home Financials are based on the most recent Mortgage that was taken out on this home.
Original Mortgage
$136,719
Interest Rate
6.74%
Purchase Details
Closed on
Sep 1, 1989
Bought by
Richards Jesse L and Richards Linda G
Create a Home Valuation Report for This Property
The Home Valuation Report is an in-depth analysis detailing your home's value as well as a comparison with similar homes in the area
Home Values in the Area
Average Home Value in this Area
Purchase History
| Date | Buyer | Sale Price | Title Company |
|---|---|---|---|
| Johnson Keisha L | $120,000 | -- | |
| Hale James M | $110,500 | -- | |
| Bank Of America Na | $95,460 | -- | |
| Waynick Roger L | $137,800 | -- | |
| Richards Jesse L | $1,000 | -- |
Source: Public Records
Mortgage History
| Date | Status | Borrower | Loan Amount |
|---|---|---|---|
| Open | Johnson Keisha L | $123,393 | |
| Previous Owner | Richards Jesse L | $136,719 |
Source: Public Records
Tax History Compared to Growth
Tax History
| Year | Tax Paid | Tax Assessment Tax Assessment Total Assessment is a certain percentage of the fair market value that is determined by local assessors to be the total taxable value of land and additions on the property. | Land | Improvement |
|---|---|---|---|---|
| 2024 | $1,168 | $64,900 | $13,300 | $51,600 |
| 2023 | $1,168 | $64,900 | $13,300 | $51,600 |
| 2022 | $1,187 | $46,100 | $6,925 | $39,175 |
| 2021 | $1,187 | $46,100 | $6,925 | $39,175 |
| 2020 | $1,187 | $46,100 | $6,925 | $39,175 |
| 2019 | $1,187 | $46,100 | $6,925 | $39,175 |
| 2018 | $1,187 | $46,100 | $6,925 | $39,175 |
| 2017 | $1,003 | $32,525 | $6,175 | $26,350 |
| 2016 | $1,003 | $32,525 | $6,175 | $26,350 |
| 2015 | $963 | $32,525 | $6,175 | $26,350 |
| 2014 | $963 | $32,525 | $6,175 | $26,350 |
Source: Public Records
Map
Nearby Homes
- 3225 Pinson School Rd
- 6015 Highway 76 E
- 1074 Pair Six Dr
- 131 Filly Ln
- 136 Filly Ln
- 144 Filly Ln
- 405 Arabian Ln
- 148 Brandywine Ln
- 312 Brandywine Ln
- 344 Brandywine Ln
- 1049 Moncrief Cir
- 340 Fieldstone Ln
- 349 Fieldstone Ln
- 6615 Herbert Shannon Rd
- 6838 Highway 76 E
- 1024 Moncrief Cir
- 6012 Bethlehem Rd
- 5827 Highway 76 E
- 1010 Moncrief Cir
- 412 W Foxrun Run
- 3380 Possum Trot Rd
- 3410 Possum Trot Rd
- 3377 Possum Trot Rd
- 3366 Possum Trot Rd
- 3366 Possum Trot Rd
- 3333 Possum Trot Rd
- 3451 Possum Trot Rd
- 3313 Possum Trot Rd
- 6753 Highway 76 E
- 6753 Highway 76 E
- 6753 Highway 76 E
- 3579 Pinson School Rd Unit 2
- 3308 Possum Trot Rd
- 3547 Pinson School Rd
- 3302 Possum Trot Rd
- 3469 Pinson School Rd
- 3602 Pinson School Rd
- 3578 Pinson School Rd
- 6477 Highway 76 E
- 6477 Highway 76 E