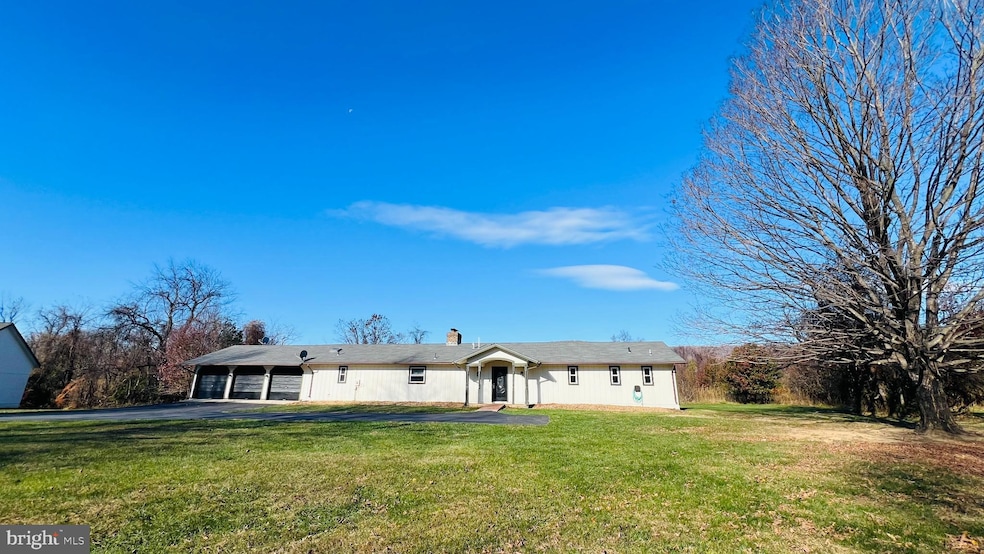
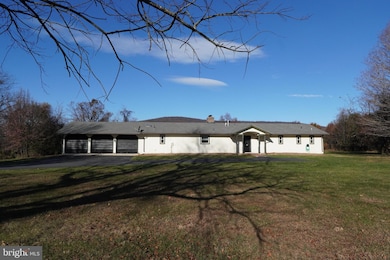
33900 Austin Grove Rd Bluemont, VA 20135
Estimated payment $5,304/month
Highlights
- Hot Property
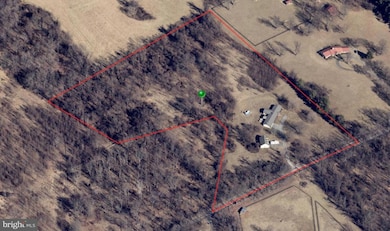
- 10 Acre Lot
- Rambler Architecture
- Blue Ridge Middle School Rated A-
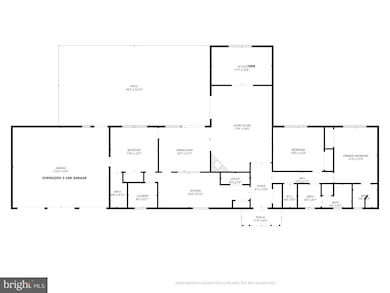
- Open Floorplan
- Main Floor Bedroom
About This Home
Private Single-Level Living on 10 Scenic Acres in Loudoun, Featuring Mountain Views, a 3-Car Attached Garage, and an Oversized 2-Bay Detached Garage with Bonus Space. Professional photos to follow. Discover an exceptional opportunity to own a charming home, thoughtfully designed to meet the needs of modern main floor living. This well-maintained home, built in 1986, boasts a generous 2,184 square feet of living space, featuring three spacious bedrooms, a well lit den/office or sunroom and two and a half bathrooms, providing ample room for relaxation and privacy. 3-car attached garage and a generous oversized detached 2-car garage with ample storage and attic space. The inviting layout includes a cozy fireplace, perfect for creating a warm ambiance during cooler months. The property is situated on a sprawling 10-acre lot, offering endless possibilities for outdoor activities, gardening, or simply enjoying the tranquility of nature. Enjoy the backyard's panoramic mountain views from the oversized patio or unwind beneath the charming gazebo, ideal for year-round relaxation. For the ultimate retreat experience, take a dip in the outdoor soaking spa/hot tub, surrounded by serene landscapes. Modern kitchen with white cabinets, stainless steel appliances, front loading washer and dryer, water softener, invisible fence, rear shed, new furnace, new carpet, professionally painted, so much more. Whether you're entertaining guests or enjoying quiet evenings under the stars, this outdoor haven delivers peace, privacy, and endless possibilities. The home's design emphasizes functionality and comfort, making it an ideal choice for those seeking a peaceful retreat while remaining conveniently close to local amenities. The expansive outdoor space allows for potential expansion or the addition of recreational facilities, catering to a variety of lifestyle preferences. With no association fees, you have the freedom to personalize your property. This residence is not just a house; it is a canvas for your vision, ready to be transformed into your dream home. Experience the perfect blend of space, comfort, and potential in this remarkable property.
Listing Agent
(571) 466-6002 nina.yalung@lnf.com Long & Foster Real Estate, Inc. License #0225224813 Listed on: 11/23/2025

Home Details
Home Type
- Single Family
Est. Annual Taxes
- $6,607
Year Built
- Built in 1986 | Remodeled in 2005
Lot Details
- 10 Acre Lot
- Property is in excellent condition
- Property is zoned AR2
Parking
- 5 Garage Spaces | 3 Attached and 2 Detached
- Parking Storage or Cabinetry
- Front Facing Garage
- Garage Door Opener
- Driveway
Home Design
- Rambler Architecture
- Wood Siding
Interior Spaces
- 2,184 Sq Ft Home
- Property has 1 Level
- Open Floorplan
- Ceiling Fan
- Recessed Lighting
- 1 Fireplace
- Den
Kitchen
- Electric Oven or Range
- Built-In Microwave
- Extra Refrigerator or Freezer
- Dishwasher
- Stainless Steel Appliances
Bedrooms and Bathrooms
- 3 Main Level Bedrooms
- Soaking Tub
Laundry
- Front Loading Dryer
- Front Loading Washer
Utilities
- Central Heating and Cooling System
- Heating System Powered By Leased Propane
- Well
- Propane Water Heater
- Septic Tank
- Private Sewer
Community Details
- No Home Owners Association
- Grassland Subdivision
Listing and Financial Details
- Assessor Parcel Number 653497678000
Map
Home Values in the Area
Average Home Value in this Area
Tax History
| Year | Tax Paid | Tax Assessment Tax Assessment Total Assessment is a certain percentage of the fair market value that is determined by local assessors to be the total taxable value of land and additions on the property. | Land | Improvement |
|---|---|---|---|---|
| 2025 | $6,607 | $820,760 | $374,000 | $446,760 |
| 2024 | $6,531 | $755,070 | $313,000 | $442,070 |
| 2023 | $6,105 | $697,680 | $298,000 | $399,680 |
| 2022 | $5,567 | $625,540 | $258,000 | $367,540 |
| 2021 | $5,197 | $530,280 | $238,000 | $292,280 |
| 2020 | $5,244 | $506,620 | $238,000 | $268,620 |
| 2019 | $5,223 | $499,830 | $238,000 | $261,830 |
| 2018 | $5,351 | $493,220 | $238,000 | $255,220 |
| 2017 | $5,251 | $466,760 | $238,000 | $228,760 |
| 2016 | $5,412 | $472,700 | $0 | $0 |
| 2015 | $5,453 | $242,400 | $0 | $242,400 |
| 2014 | $5,344 | $238,970 | $0 | $238,970 |
Property History
| Date | Event | Price | List to Sale | Price per Sq Ft |
|---|---|---|---|---|
| 11/23/2025 11/23/25 | For Sale | $900,000 | -- | $412 / Sq Ft |
Purchase History
| Date | Type | Sale Price | Title Company |
|---|---|---|---|
| Interfamily Deed Transfer | -- | None Available | |
| Deed | $105,000 | -- | |
| Deed | -- | -- |
Mortgage History
| Date | Status | Loan Amount | Loan Type |
|---|---|---|---|
| Open | $246,750 | No Value Available |
Source: Bright MLS
MLS Number: VALO2111036
APN: 653-49-7678
Disclaimer: Certain information contained herein is derived from information provided by parties other than Homes.com. All information provided is deemed reliable, but is not guaranteed to be accurate and should be independently verified.
![]() The data relating to real estate for sale on this website appears in part through the BRIGHT Internet Data Exchange program, a voluntary cooperative exchange of property listing data between licensed real estate brokerage firms, and is provided by BRIGHT through a licensing agreement.
The data relating to real estate for sale on this website appears in part through the BRIGHT Internet Data Exchange program, a voluntary cooperative exchange of property listing data between licensed real estate brokerage firms, and is provided by BRIGHT through a licensing agreement.
Listing information is from various brokers who participate in the Bright MLS IDX program and not all listings may be visible on the site.
The property information being provided on or through the website is for the personal, non-commercial use of consumers and such information may not be used for any purpose other than to identify prospective properties consumers may be interested in purchasing.
Some properties which appear for sale on the website may no longer be available because they are for instance, under contract, sold or are no longer being offered for sale.
Property information displayed is deemed reliable but is not guaranteed.
Copyright 2025 Bright MLS, Inc.
- 19935 Foggy Bottom Rd
- 33692 Austin Grove Rd
- 19798 Foggy Bottom Rd
- 20596 Airmont Rd
- 18590 appx Foggy Bottom Rd
- 34321 Foxwood Ln
- 32651 Mount Weather Rd
- 0 Snickerville Tunrpike
- 0 Christmas Tree Ln
- 0 Blue Ridge Mountain Rd
- 18344 Railroad St
- 35632 Snickersville Turnpike
- 33563 Snickersville Turnpike
- 18291 Calumet Ln
- 21515 Trappe Rd
- 0 Saint Louis Rd
- 161 Bell Hollow Ln
- 20209 St Louis Rd
- 21846 Trappe Rd
- 36155 Chamblin Mill Ln
- 22260 Saint Louis Rd
- 132 Pinecrest Ln
- 440 Redbud Ln
- 2459 Frogtown Rd
- 12 W Loudoun St Unit A
- 6 W Loudoun St
- 19 N Bridge St Unit 201
- 19 N Bridge St Unit STUDIO
- 67 Willow Lake Ln
- 988 Chilly Hollow Rd
- 18685 Haps Ln
- 341 S 26th St Unit A
- 300 W K St
- 401 Yorkshire Ridge Ct
- 2211 Hatchers Mill Rd
- 116 Desales Dr
- 18285 Foundry Rd
- 562 Smithfield Ln
- 708 Irvine Bank Ln
- 111-123 N 16th St