R
Seller's Agent in 2025
Richard Kost
RE/MAX
(614) 478-2121
1 in this area
14 Total Sales
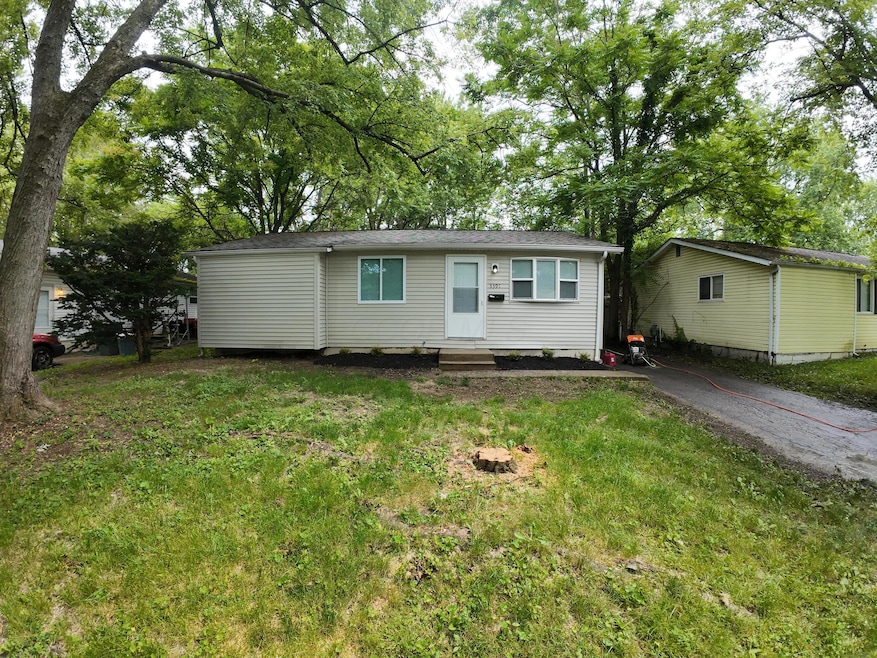
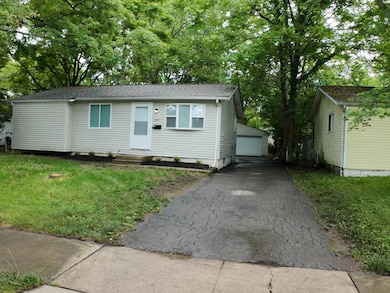
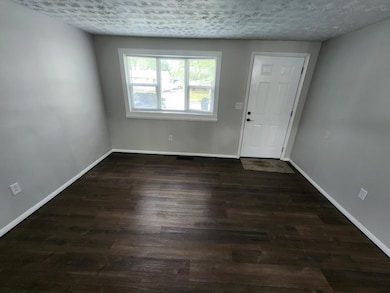
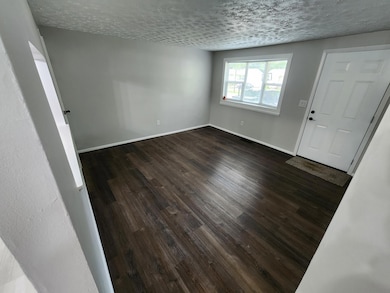
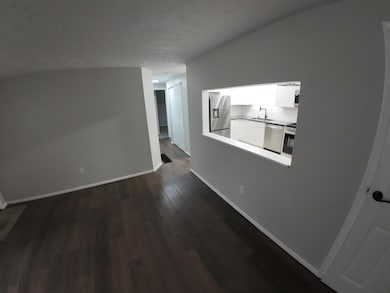
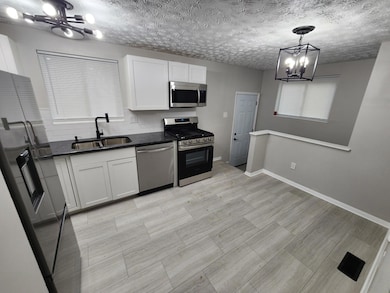
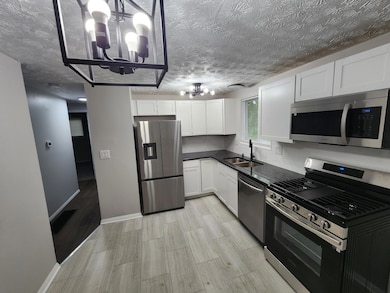
Welcome to this beautifully maintained 3-bedroom, 1-bath home that perfectly blends comfort and simplicity. Step into a warm and inviting living room—ideal for relaxing after a long day. All three bedrooms offer ample space, whether you're accommodating family, visitors, or creating a home office. The full bathroom is centrally located and thoughtfully updated for convenience.
Situated on a single level, this home is ideal for all stages of life. Don't miss your chance to own this cozy gem!
Last Agent to Sell the Property
RE/MAX Connection License #0000211435 Listed on: 06/27/2025

| Date | Type | Sale Price | Title Company |
|---|---|---|---|
| Warranty Deed | $180,000 | Chase Title & Escrow Services | |
| Quit Claim Deed | -- | Chase Title Box | |
| Survivorship Deed | $34,000 | Land Sel Ti | |
| Deed | $58,039 | -- | |
| Deed | $56,000 | -- |
| Date | Status | Loan Amount | Loan Type |
|---|---|---|---|
| Open | $180,000 | VA | |
| Previous Owner | $60,000 | Purchase Money Mortgage | |
| Previous Owner | $57,540 | VA |
| Date | Event | Price | List to Sale | Price per Sq Ft |
|---|---|---|---|---|
| 08/15/2025 08/15/25 | Sold | $180,000 | -2.7% | $215 / Sq Ft |
| 06/09/2025 06/09/25 | For Sale | $184,900 | -- | $221 / Sq Ft |
| Year | Tax Paid | Tax Assessment Tax Assessment Total Assessment is a certain percentage of the fair market value that is determined by local assessors to be the total taxable value of land and additions on the property. | Land | Improvement |
|---|---|---|---|---|
| 2025 | $5,277 | $46,130 | $16,450 | $29,680 |
| 2024 | $5,277 | $46,130 | $16,450 | $29,680 |
| 2023 | $2,800 | $46,130 | $16,450 | $29,680 |
| 2022 | $902 | $16,980 | $6,340 | $10,640 |
| 2021 | $1,450 | $16,980 | $6,340 | $10,640 |
| 2020 | $1,335 | $16,980 | $6,340 | $10,640 |
| 2019 | $806 | $12,960 | $5,080 | $7,880 |
| 2018 | $873 | $12,960 | $5,080 | $7,880 |
| 2017 | $806 | $12,960 | $5,080 | $7,880 |
| 2016 | $1,206 | $17,750 | $4,410 | $13,340 |
| 2015 | $942 | $14,250 | $4,410 | $9,840 |
| 2014 | $519 | $8,370 | $4,410 | $3,960 |
| 2013 | $326 | $8,820 | $4,655 | $4,165 |
R
Seller's Agent in 2025
Richard Kost
RE/MAX
(614) 478-2121
1 in this area
14 Total Sales
A
Buyer's Agent in 2025
Alkia Page
M3K Real Estate Network Inc.
(530) 788-5336
1 in this area
4 Total Sales
Source: Columbus and Central Ohio Regional MLS
MLS Number: 225020638
APN: 010-154837
Disclaimer: Certain information contained herein is derived from information provided by parties other than Homes.com. All information provided is deemed reliable, but is not guaranteed to be accurate and should be independently verified.
![]() IDX information is provided exclusively for personal, non-commercial use, and may not be used for any purpose other than to identify prospective properties consumers may be interested in purchasing.
IDX information is provided exclusively for personal, non-commercial use, and may not be used for any purpose other than to identify prospective properties consumers may be interested in purchasing.
Information is deemed reliable but not guaranteed.
Ask me questions while you tour the home.