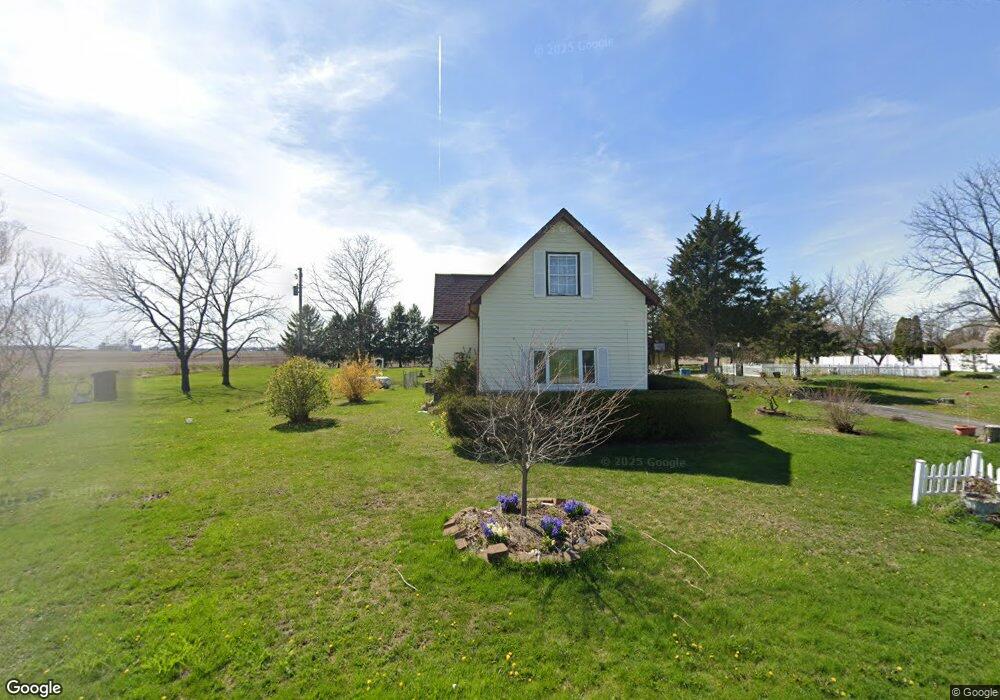
3391 N 600 E Marion, IN 46952
Estimated Value: $134,000 - $272,000
3
Beds
1
Bath
2,398
Sq Ft
$86/Sq Ft
Est. Value
About This Home
This home is located at 3391 N 600 E, Marion, IN 46952 and is currently estimated at $206,397, approximately $86 per square foot. 3391 N 600 E is a home located in Grant County.
Ownership History
Date
Name
Owned For
Owner Type
Purchase Details
Closed on
Nov 14, 2007
Sold by
Linderwell Cathy Ann
Bought by
Mccool Luther A and Mccool Janice S
Current Estimated Value
Purchase Details
Closed on
Apr 29, 2005
Sold by
Hale Donald E
Bought by
Cole Andrew M and Cole Christina G
Home Financials for this Owner
Home Financials are based on the most recent Mortgage that was taken out on this home.
Original Mortgage
$209,327
Interest Rate
6.06%
Mortgage Type
Construction
Create a Home Valuation Report for This Property
The Home Valuation Report is an in-depth analysis detailing your home's value as well as a comparison with similar homes in the area
Purchase History
| Date | Buyer | Sale Price | Title Company |
|---|---|---|---|
| Mccool Luther A | -- | None Available | |
| Cole Andrew M | -- | None Available |
Source: Public Records
Mortgage History
| Date | Status | Borrower | Loan Amount |
|---|---|---|---|
| Previous Owner | Cole Andrew M | $209,327 |
Source: Public Records
Tax History
| Year | Tax Paid | Tax Assessment Tax Assessment Total Assessment is a certain percentage of the fair market value that is determined by local assessors to be the total taxable value of land and additions on the property. | Land | Improvement |
|---|---|---|---|---|
| 2025 | $559 | $130,000 | $29,300 | $100,700 |
| 2024 | $559 | $135,200 | $29,300 | $105,900 |
| 2023 | $479 | $129,000 | $29,300 | $99,700 |
| 2022 | $412 | $113,500 | $23,600 | $89,900 |
| 2021 | $326 | $98,800 | $23,600 | $75,200 |
| 2020 | $279 | $95,600 | $23,600 | $72,000 |
| 2019 | $241 | $92,400 | $23,600 | $68,800 |
| 2018 | $196 | $85,700 | $23,600 | $62,100 |
| 2017 | $163 | $81,100 | $23,600 | $57,500 |
| 2016 | $213 | $81,200 | $23,600 | $57,600 |
| 2014 | $122 | $77,500 | $23,600 | $53,900 |
| 2013 | $122 | $77,600 | $23,600 | $54,000 |
Source: Public Records
Map
Nearby Homes
- 4015 N 600 E
- 2804 N 800 E
- 4420 E 100 N
- 603 W Main St
- 8885 E 400 N
- 402 N 600 E
- 201 E Vine St
- 619 S 600 E
- 9964 E 400 N
- 8219 E 100 S
- 933 E Bocock Rd
- 1700 E Bradford Pike
- 1270 S 600 E
- 3220 N Huntington Rd
- I 69 E 700 N
- 3105 N Huntington Rd
- 703 E Bond Ave
- 1113 E Grant St
- 2325 N Huntington Rd
- 2220 N Huntington Rd
Your Personal Tour Guide
Ask me questions while you tour the home.