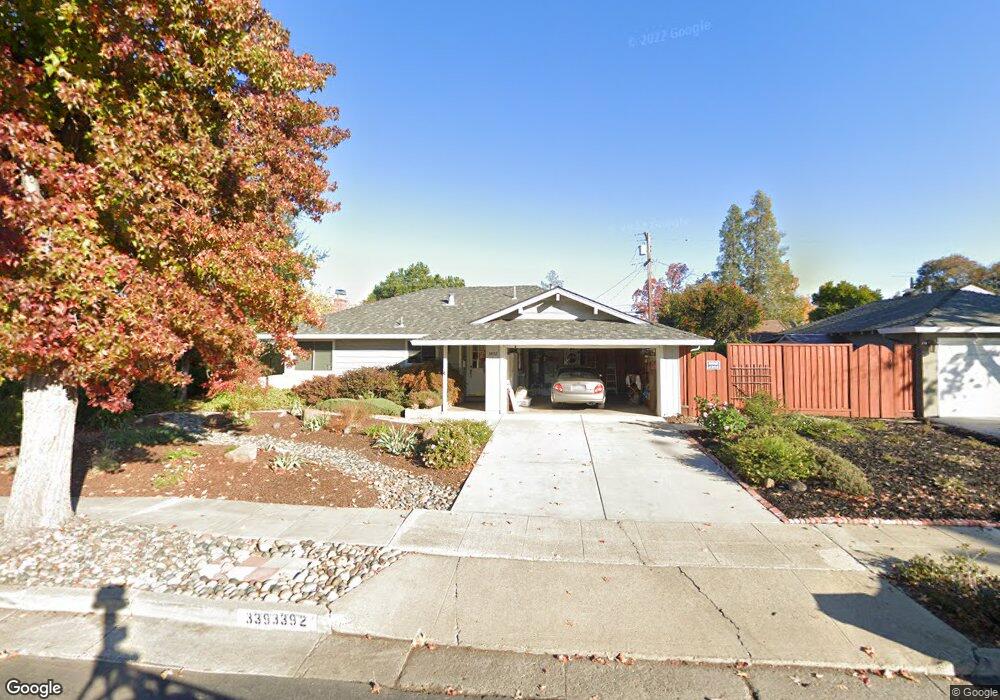
3392 Elaine Dr San Jose, CA 95124
Cambrian NeighborhoodEstimated Value: $1,692,314 - $1,812,000
3
Beds
2
Baths
1,281
Sq Ft
$1,385/Sq Ft
Est. Value
About This Home
This home is located at 3392 Elaine Dr, San Jose, CA 95124 and is currently estimated at $1,774,079, approximately $1,384 per square foot. 3392 Elaine Dr is a home located in Santa Clara County with nearby schools including Branham High School, Farnham Elementary School, and Fammatre Elementary School.
Ownership History
Date
Name
Owned For
Owner Type
Purchase Details
Closed on
Jan 12, 2022
Sold by
Mccrae Family Revocable Living Trust
Bought by
Claire M Mccrae Revocable Trust
Current Estimated Value
Purchase Details
Closed on
Mar 4, 2021
Sold by
Stephens Richard A and Stephens Diana C
Bought by
Stephens Family Trust
Purchase Details
Closed on
Oct 30, 2012
Sold by
Mccrae Arthur W and Mccrae Claire M
Bought by
Mccrae Arthur W and Mccrae Claire M
Purchase Details
Closed on
Apr 26, 2005
Sold by
Mccrae Claire M
Bought by
Mccrae Arthur W and Mccrae Claire M
Purchase Details
Closed on
Jan 12, 1999
Sold by
Hoy Roger V and Hoy Janet A
Bought by
Mccrae Claire
Home Financials for this Owner
Home Financials are based on the most recent Mortgage that was taken out on this home.
Original Mortgage
$150,000
Interest Rate
6.63%
Purchase Details
Closed on
Aug 13, 1997
Sold by
Hoy Roger V and Hoy Janet A
Bought by
Hoy Roger and Hoy Janet A
Create a Home Valuation Report for This Property
The Home Valuation Report is an in-depth analysis detailing your home's value as well as a comparison with similar homes in the area
Home Values in the Area
Average Home Value in this Area
Purchase History
| Date | Buyer | Sale Price | Title Company |
|---|---|---|---|
| Claire M Mccrae Revocable Trust | -- | None Listed On Document | |
| Stephens Family Trust | -- | None Listed On Document | |
| Mccrae Arthur W | $250,000 | North American Title Company | |
| Mccrae Arthur W | -- | -- | |
| Mccrae Claire | $300,000 | American Title Co | |
| Hoy Roger | -- | -- |
Source: Public Records
Mortgage History
| Date | Status | Borrower | Loan Amount |
|---|---|---|---|
| Previous Owner | Mccrae Claire | $150,000 |
Source: Public Records
Tax History Compared to Growth
Tax History
| Year | Tax Paid | Tax Assessment Tax Assessment Total Assessment is a certain percentage of the fair market value that is determined by local assessors to be the total taxable value of land and additions on the property. | Land | Improvement |
|---|---|---|---|---|
| 2025 | $7,136 | $469,509 | $345,673 | $123,836 |
| 2024 | $7,136 | $460,304 | $338,896 | $121,408 |
| 2023 | $7,132 | $451,279 | $332,251 | $119,028 |
| 2022 | $7,011 | $442,432 | $325,737 | $116,695 |
| 2021 | $6,834 | $433,757 | $319,350 | $114,407 |
| 2020 | $6,513 | $429,310 | $316,076 | $113,234 |
| 2019 | $6,412 | $420,893 | $309,879 | $111,014 |
| 2018 | $6,234 | $412,641 | $303,803 | $108,838 |
| 2017 | $5,989 | $404,551 | $297,847 | $106,704 |
| 2016 | $5,701 | $396,619 | $292,007 | $104,612 |
| 2015 | $5,625 | $390,662 | $287,621 | $103,041 |
| 2014 | $5,128 | $383,010 | $281,987 | $101,023 |
Source: Public Records
Map
Nearby Homes
- 3335 Jennifer Way
- 3429 New Jersey Ave
- 1921 Camden Ave
- 14361 Lenray Ln
- 2088 Cully Place
- 2896 Union Ave
- 3328 Kimber Ct Unit 21
- 2925 Newark Way
- 2985 Lantz Ave
- 14570 Wyrick Ave
- 2888 Lantz Ave
- 1505 Love Ct
- 1507 Love Ct
- 1502 Love Ct
- 1501 Paradise Ct
- 1500 Paradise Ct
- 2265 Sun Glory Ln Unit A
- 1828 Nestorita Way
- 1503 Love Ct
- 3461 Wine Cask Way
- 3412 Elaine Dr
- 3397 Browning Ave
- 3417 Browning Ave
- 3377 Browning Ave
- 3354 Elaine Dr
- 3432 Elaine Dr
- 3433 Browning Ave
- 3391 Elaine Dr
- 3409 Elaine Dr
- 3359 Browning Ave
- 3371 Elaine Dr
- 3429 Elaine Dr
- 3334 Elaine Dr
- 3452 Elaine Dr
- 3353 Elaine Dr
- 3339 Browning Ave
- 3447 Elaine Dr Unit 3447 Elaine Drive
- 3447 Elaine Dr
- 3449 Browning Ave
- 3394 Browning Ave