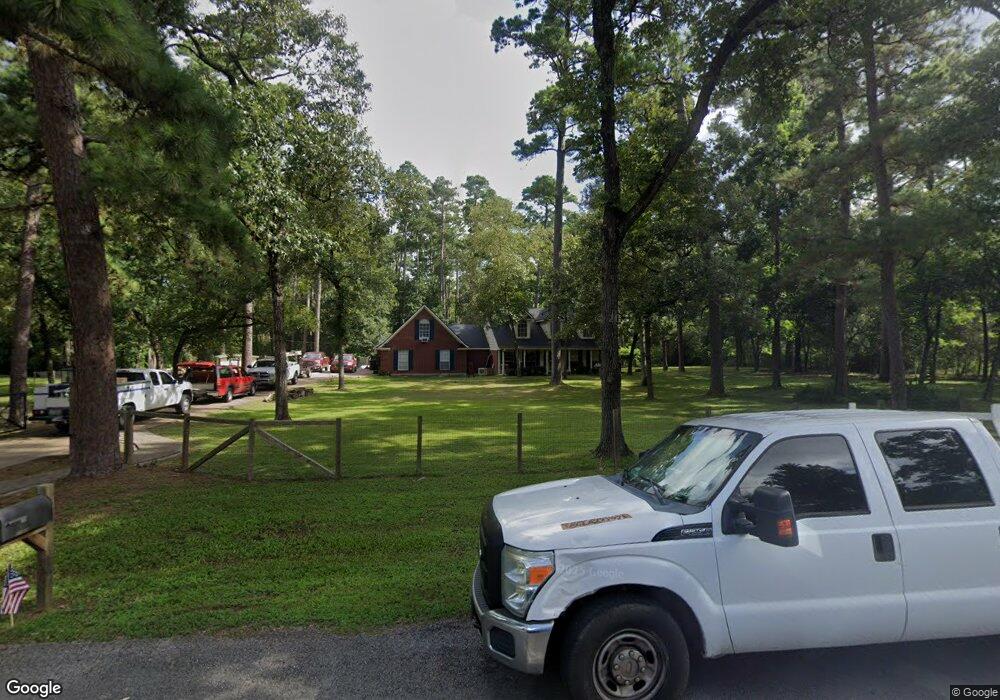
33924 Deer Creek Way Stagecoach, TX 77355
Estimated Value: $521,000 - $573,000
3
Beds
2
Baths
2,287
Sq Ft
$237/Sq Ft
Est. Value
About This Home
This home is located at 33924 Deer Creek Way, Stagecoach, TX 77355 and is currently estimated at $541,355, approximately $236 per square foot. 33924 Deer Creek Way is a home located in Montgomery County with nearby schools including Decker Prairie Elementary School, Tomball Intermediate School, and Tomball Junior High School.
Ownership History
Date
Name
Owned For
Owner Type
Purchase Details
Closed on
Jul 16, 2020
Sold by
Groschke Kevin and Blanco Roberta
Bought by
Murtaugh Paul Jason and Murtaugh Lauren Elizabeth
Current Estimated Value
Home Financials for this Owner
Home Financials are based on the most recent Mortgage that was taken out on this home.
Original Mortgage
$300,000
Outstanding Balance
$266,020
Interest Rate
3.1%
Mortgage Type
New Conventional
Estimated Equity
$275,335
Purchase Details
Closed on
Sep 11, 2015
Sold by
Strange Jacqualyn
Bought by
Groschke Kevin and Blanco Roberta
Home Financials for this Owner
Home Financials are based on the most recent Mortgage that was taken out on this home.
Original Mortgage
$258,800
Interest Rate
4.03%
Mortgage Type
New Conventional
Purchase Details
Closed on
Oct 2, 1996
Sold by
Dunbar John C
Bought by
Groschke Kevin and Roberta Blanco
Create a Home Valuation Report for This Property
The Home Valuation Report is an in-depth analysis detailing your home's value as well as a comparison with similar homes in the area
Home Values in the Area
Average Home Value in this Area
Purchase History
| Date | Buyer | Sale Price | Title Company |
|---|---|---|---|
| Murtaugh Paul Jason | -- | Allegiance Title | |
| Groschke Kevin | -- | Stewart Title | |
| Groschke Kevin | -- | -- |
Source: Public Records
Mortgage History
| Date | Status | Borrower | Loan Amount |
|---|---|---|---|
| Open | Murtaugh Paul Jason | $300,000 | |
| Previous Owner | Groschke Kevin | $258,800 |
Source: Public Records
Tax History Compared to Growth
Tax History
| Year | Tax Paid | Tax Assessment Tax Assessment Total Assessment is a certain percentage of the fair market value that is determined by local assessors to be the total taxable value of land and additions on the property. | Land | Improvement |
|---|---|---|---|---|
| 2025 | $8,266 | $524,962 | -- | -- |
| 2024 | $8,917 | $477,238 | $144,500 | $332,738 |
| 2023 | $8,917 | $445,000 | $144,500 | $300,500 |
| 2022 | $9,234 | $412,500 | $144,500 | $300,500 |
| 2021 | $8,843 | $375,000 | $150,000 | $225,000 |
| 2020 | $9,360 | $379,920 | $150,000 | $245,930 |
| 2019 | $8,406 | $345,380 | $150,000 | $262,810 |
| 2018 | $6,156 | $313,980 | $69,000 | $262,880 |
| 2017 | $7,367 | $285,440 | $22,500 | $262,940 |
| 2016 | $8,275 | $320,630 | $22,500 | $298,130 |
| 2015 | $4,536 | $196,960 | $22,500 | $208,760 |
| 2014 | $4,536 | $179,050 | $22,500 | $213,130 |
Source: Public Records
Map
Nearby Homes
- 15245 Shady Oaks Dr
- 15823 Stagecoach Rd
- 15450 Shady Oaks Dr
- 15937 Stagecoach Rd
- 15019 Timbershire Ct
- 14810 Timberleaf Dr
- 2102 Candy St
- TBD Stagecoach Rd
- 603 Terri Ln
- 0 Frontier Rd
- 2103 Diane St
- 14419 Timbergreen Dr
- 33710 Walnut Grove Dr
- TBD Cimmaron Dr
- 33401 Doe Dr
- 16407 Wagon Wheel Rd
- 1426 Northwood Bluff Ln
- 0 Boothill Rd Unit 38015944
- 1439 Northwood Bluff Ln
- 16633 Cimmaron Dr
- 34002 Deer Creek Way
- 34014 Deer Creek Way
- 33910 Deer Creek Way
- 34018 Deer Creek Way
- 33821 Deer Creek Way
- 34015 Deer Creek Way
- 15127 Timbershade Crossing
- 33820 Deer Creek Way
- 15126 Timbershade Crossing
- 33816 Deer Creek Way
- 15320 Shady Oaks Dr
- 15212 Shady Oaks Dr
- 15922 Pine Creek Way
- 1926 Timber Ranch Dr
- 15118 Timbershade Crossing
- 1922 Timber Ranch Dr
- 33814 Deer Creek Way
- 2134 Timbergreen Cir
- 1910 Timber Ranch Dr
- 15340 Shady Oaks Dr