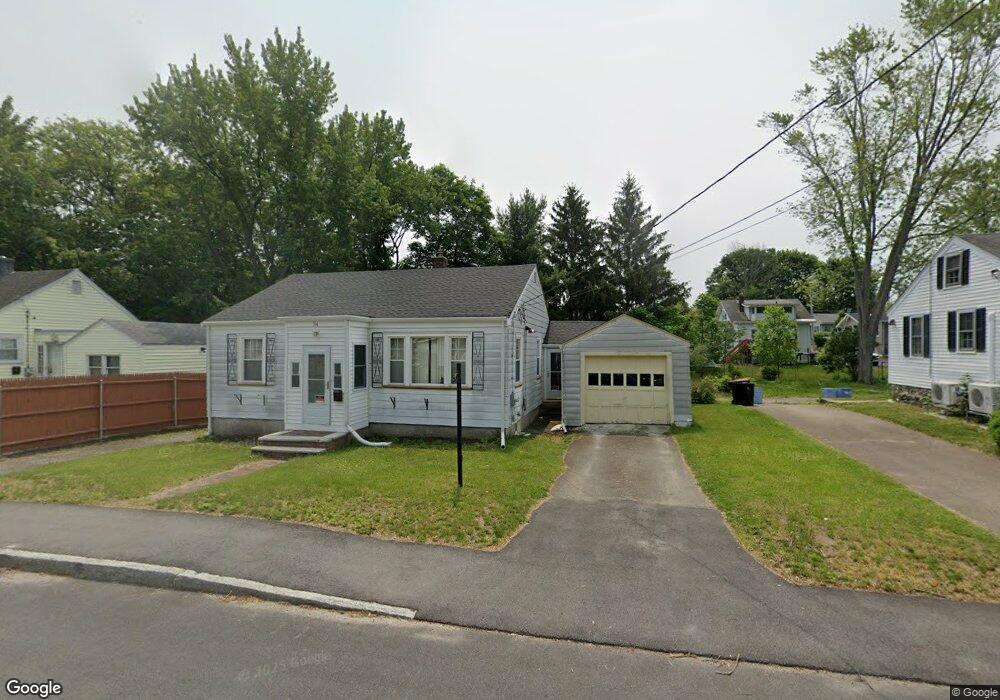
34 Carroll Ave Brockton, MA 02301
Clifton Heights NeighborhoodEstimated Value: $371,672 - $441,000
2
Beds
1
Bath
788
Sq Ft
$517/Sq Ft
Est. Value
About This Home
This home is located at 34 Carroll Ave, Brockton, MA 02301 and is currently estimated at $407,168, approximately $516 per square foot. 34 Carroll Ave is a home located in Plymouth County with nearby schools including Gilmore Elementary School, John F. Kennedy Elementary School, and Davis K-8 School.
Ownership History
Date
Name
Owned For
Owner Type
Purchase Details
Closed on
Sep 10, 2004
Sold by
Harvey Roberta R
Bought by
Clarke Marcia E
Current Estimated Value
Home Financials for this Owner
Home Financials are based on the most recent Mortgage that was taken out on this home.
Original Mortgage
$123,120
Outstanding Balance
$61,809
Interest Rate
6.08%
Mortgage Type
Purchase Money Mortgage
Estimated Equity
$345,359
Purchase Details
Closed on
Dec 31, 1997
Sold by
Nelson Mildred M
Bought by
Harvey Richard W and Harvey Lillian J
Create a Home Valuation Report for This Property
The Home Valuation Report is an in-depth analysis detailing your home's value as well as a comparison with similar homes in the area
Home Values in the Area
Average Home Value in this Area
Purchase History
| Date | Buyer | Sale Price | Title Company |
|---|---|---|---|
| Clarke Marcia E | $228,900 | -- | |
| Harvey Richard W | $52,900 | -- |
Source: Public Records
Mortgage History
| Date | Status | Borrower | Loan Amount |
|---|---|---|---|
| Open | Harvey Richard W | $123,120 | |
| Closed | Harvey Richard W | $45,800 | |
| Closed | Harvey Richard W | $5,755 | |
| Previous Owner | Harvey Richard W | $25,000 |
Source: Public Records
Tax History
| Year | Tax Paid | Tax Assessment Tax Assessment Total Assessment is a certain percentage of the fair market value that is determined by local assessors to be the total taxable value of land and additions on the property. | Land | Improvement |
|---|---|---|---|---|
| 2025 | $4,277 | $353,200 | $140,100 | $213,100 |
| 2024 | $3,903 | $324,700 | $140,100 | $184,600 |
| 2023 | $3,650 | $281,200 | $104,500 | $176,700 |
| 2022 | $3,363 | $240,700 | $95,000 | $145,700 |
| 2021 | $3,270 | $225,500 | $78,900 | $146,600 |
| 2020 | $3,221 | $212,600 | $73,900 | $138,700 |
| 2019 | $2,936 | $188,900 | $72,100 | $116,800 |
| 2018 | $2,325 | $144,800 | $72,100 | $72,700 |
| 2017 | $2,211 | $137,300 | $72,100 | $65,200 |
| 2016 | $2,208 | $127,200 | $69,900 | $57,300 |
| 2015 | $1,938 | $106,800 | $69,900 | $36,900 |
| 2014 | $2,051 | $113,100 | $69,900 | $43,200 |
Source: Public Records
Map
Nearby Homes
Your Personal Tour Guide
Ask me questions while you tour the home.