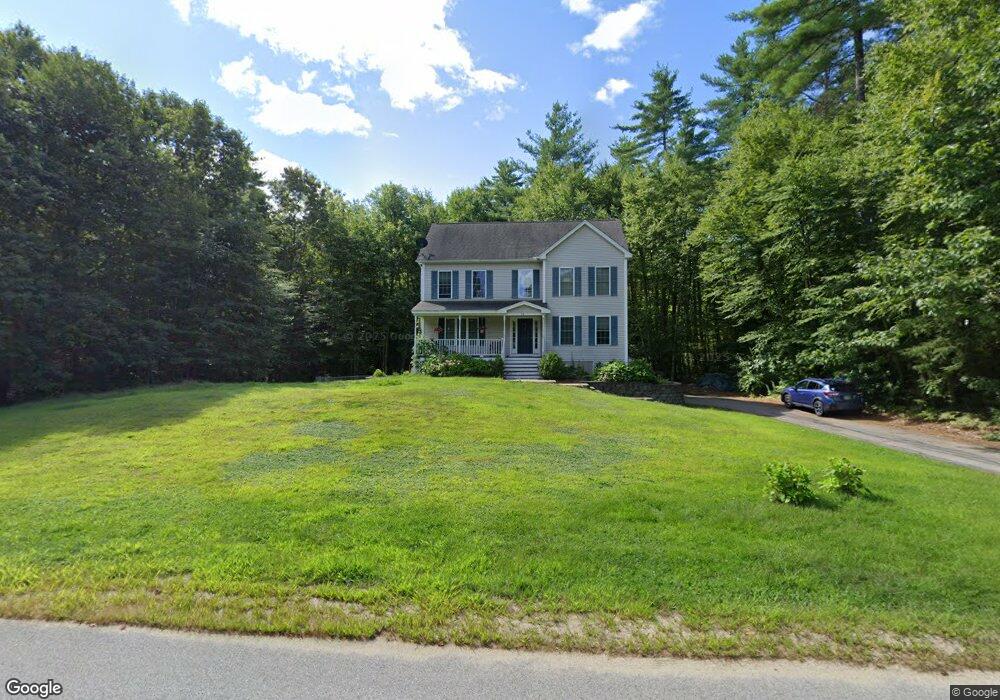
34 Franks Way Epping, NH 03042
Estimated Value: $639,930 - $653,000
3
Beds
3
Baths
2,446
Sq Ft
$265/Sq Ft
Est. Value
About This Home
This home is located at 34 Franks Way, Epping, NH 03042 and is currently estimated at $647,233, approximately $264 per square foot. 34 Franks Way is a home located in Rockingham County with nearby schools including Epping Elementary School, Epping Middle School, and Epping High School.
Ownership History
Date
Name
Owned For
Owner Type
Purchase Details
Closed on
Jun 28, 2011
Sold by
Bellantone Marc D and Bellantone Angela J
Bought by
King Kevin M and King Rachel M
Current Estimated Value
Home Financials for this Owner
Home Financials are based on the most recent Mortgage that was taken out on this home.
Original Mortgage
$195,000
Outstanding Balance
$134,912
Interest Rate
4.63%
Mortgage Type
Purchase Money Mortgage
Estimated Equity
$512,321
Purchase Details
Closed on
May 16, 2007
Sold by
Cartus Financial Corp
Bought by
Bellantone Marc D and Bellantone Angela J
Home Financials for this Owner
Home Financials are based on the most recent Mortgage that was taken out on this home.
Original Mortgage
$247,500
Interest Rate
6.18%
Mortgage Type
Purchase Money Mortgage
Purchase Details
Closed on
Apr 30, 2003
Sold by
Robert Maslowski Build
Bought by
Shoemaker Bryan M and Shoemaker Jennifer L
Home Financials for this Owner
Home Financials are based on the most recent Mortgage that was taken out on this home.
Original Mortgage
$239,920
Interest Rate
5.82%
Create a Home Valuation Report for This Property
The Home Valuation Report is an in-depth analysis detailing your home's value as well as a comparison with similar homes in the area
Home Values in the Area
Average Home Value in this Area
Purchase History
| Date | Buyer | Sale Price | Title Company |
|---|---|---|---|
| King Kevin M | $270,000 | -- | |
| Bellantone Marc D | $330,000 | -- | |
| Shoemaker Bryan M | $299,900 | -- |
Source: Public Records
Mortgage History
| Date | Status | Borrower | Loan Amount |
|---|---|---|---|
| Open | Shoemaker Bryan M | $195,000 | |
| Previous Owner | Shoemaker Bryan M | $247,500 | |
| Previous Owner | Shoemaker Bryan M | $239,920 |
Source: Public Records
Tax History Compared to Growth
Tax History
| Year | Tax Paid | Tax Assessment Tax Assessment Total Assessment is a certain percentage of the fair market value that is determined by local assessors to be the total taxable value of land and additions on the property. | Land | Improvement |
|---|---|---|---|---|
| 2024 | $8,654 | $343,000 | $123,400 | $219,600 |
| 2023 | $8,026 | $343,000 | $123,400 | $219,600 |
| 2022 | $7,714 | $343,000 | $123,400 | $219,600 |
| 2021 | $7,690 | $343,000 | $123,400 | $219,600 |
| 2020 | $8,109 | $343,000 | $123,400 | $219,600 |
| 2019 | $7,335 | $264,800 | $103,200 | $161,600 |
| 2018 | $6,869 | $264,800 | $103,200 | $161,600 |
| 2017 | $6,869 | $264,800 | $103,200 | $161,600 |
| 2016 | $6,866 | $264,700 | $103,200 | $161,500 |
| 2015 | $6,866 | $264,700 | $103,200 | $161,500 |
| 2014 | $6,369 | $260,800 | $103,200 | $157,600 |
| 2013 | $6,330 | $260,800 | $103,200 | $157,600 |
Source: Public Records
Map
Nearby Homes
- 35 Gatchell Way Unit B
- 51 Sunset Ridge Rd Unit 51B
- 5B Connor Ct Unit 5B
- 1A Connor Ct Unit 1A
- 55 Sunset Ridge Rd Unit 55A
- 55 Sunset Ridge Rd Unit 55B
- 1B Connor Ct Unit 1B
- 3A Connor Ct Unit 3A
- 9A Connor Ct Unit 9A
- 54 Sunset Ridge Rd Unit 54B
- 3B Connor Ct Unit 3B
- 9B Connor Ct Unit 9B
- 65 Sunset Ridge Rd Unit 65A
- 65 Sunset Ridge Rd Unit 65B
- 63 Sunset Ridge Rd Unit 63A
- 63 Sunset Ridge Rd Unit 63B
- 209 Pleasant St
- 5A Connor Ct Unit 5A
- 15 Bartlett St
- 27 Old State Rd
- 11B Gatchell Way Unit 11B
- 11 Gatchell Way Unit 11A
- 11B Gatchell Way Unit 2
- 35 Franks Way
- 35 Franks Way Unit 1
- 31 Franks Way
- 8 Gatchell Way
- 14 Gatchell Way
- 25 Franks Way
- 19 Gatchell Way
- 14 Gatchell Way
- 12 Gatchell Way
- 23 Franks Way
- 151 Pleasant St
- 155 Pleasant St
- 16 Franks Way
- 23B Gatchell Way Unit 23B
- 23A Gatchell Way Unit 23A
- 23 Gatchell Way Unit B
- 18 Hutch Ct