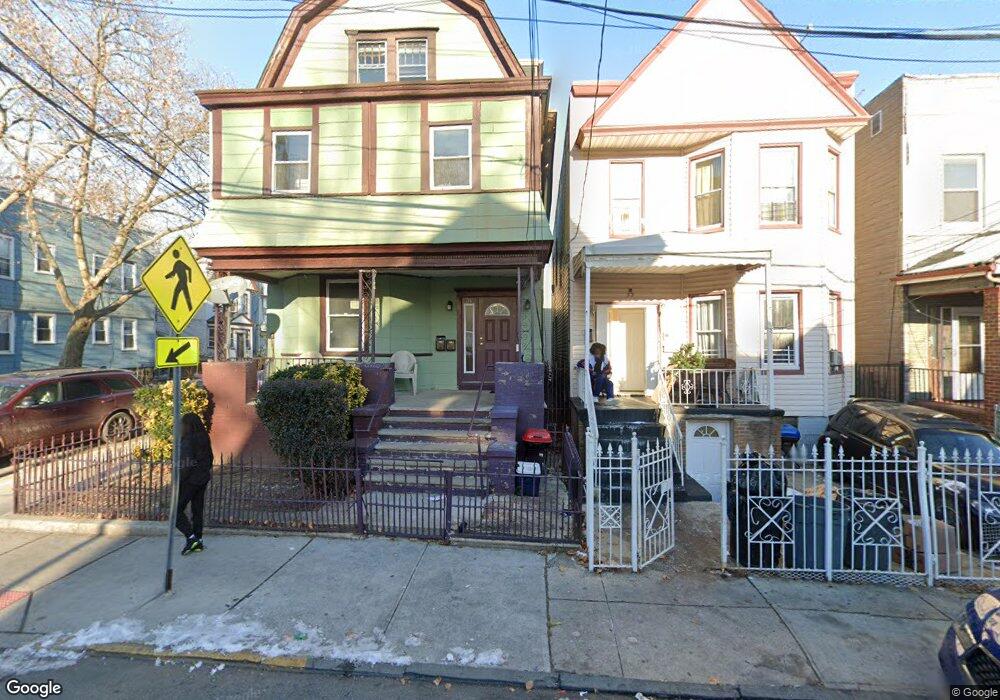
34 Fulton Ave Unit 2 Jersey City, NJ 07305
Greenville NeighborhoodEstimated Value: $625,000 - $713,000
4
Beds
1
Bath
3,186
Sq Ft
$210/Sq Ft
Est. Value
About This Home
This home is located at 34 Fulton Ave Unit 2, Jersey City, NJ 07305 and is currently estimated at $667,590, approximately $209 per square foot. 34 Fulton Ave Unit 2 is a home located in Hudson County with nearby schools including Whitney M. Young Jr. Community School, Henry Snyder High School, and Lincoln High School.
Ownership History
Date
Name
Owned For
Owner Type
Purchase Details
Closed on
Feb 23, 2021
Sold by
Goldzal Jeremy
Bought by
Cormack Lesa May
Current Estimated Value
Home Financials for this Owner
Home Financials are based on the most recent Mortgage that was taken out on this home.
Original Mortgage
$456,959
Interest Rate
2.7%
Mortgage Type
FHA
Purchase Details
Closed on
May 11, 2018
Sold by
National Enterprises Llc
Bought by
Goldzal Jeremy
Home Financials for this Owner
Home Financials are based on the most recent Mortgage that was taken out on this home.
Original Mortgage
$273,350
Interest Rate
4.5%
Mortgage Type
Adjustable Rate Mortgage/ARM
Purchase Details
Closed on
Dec 28, 2017
Sold by
Legay Nathaniel
Bought by
National Enterprsies Llc
Purchase Details
Closed on
Dec 20, 1975
Bought by
Legay Nathaniel and Legay Gloria
Create a Home Valuation Report for This Property
The Home Valuation Report is an in-depth analysis detailing your home's value as well as a comparison with similar homes in the area
Home Values in the Area
Average Home Value in this Area
Purchase History
| Date | Buyer | Sale Price | Title Company |
|---|---|---|---|
| Cormack Lesa May | $499,000 | Old Republic Natl Ttl Ins Co | |
| Cormack Lesa May | $499,000 | Old Republic Title | |
| Goldzal Jeremy | -- | None Available | |
| National Enterprsies Llc | $290,000 | Chicago Title Insco | |
| Legay Nathaniel | $13,000 | -- |
Source: Public Records
Mortgage History
| Date | Status | Borrower | Loan Amount |
|---|---|---|---|
| Previous Owner | Cormack Lesa May | $456,959 | |
| Previous Owner | Goldzal Jeremy | $273,350 |
Source: Public Records
Tax History Compared to Growth
Tax History
| Year | Tax Paid | Tax Assessment Tax Assessment Total Assessment is a certain percentage of the fair market value that is determined by local assessors to be the total taxable value of land and additions on the property. | Land | Improvement |
|---|---|---|---|---|
| 2025 | $6,869 | $307,600 | $89,000 | $218,600 |
| 2024 | $6,912 | $307,600 | $89,000 | $218,600 |
| 2023 | $6,912 | $307,600 | $89,000 | $218,600 |
| 2022 | $6,515 | $307,600 | $89,000 | $218,600 |
| 2021 | $4,934 | $307,600 | $89,000 | $218,600 |
| 2020 | $4,952 | $307,600 | $89,000 | $218,600 |
| 2019 | $4,737 | $307,600 | $89,000 | $218,600 |
| 2018 | $838 | $307,600 | $89,000 | $218,600 |
| 2017 | $4,391 | $56,300 | $9,700 | $46,600 |
| 2016 | $4,336 | $56,300 | $9,700 | $46,600 |
| 2015 | $4,212 | $56,300 | $9,700 | $46,600 |
| 2014 | $4,185 | $56,300 | $9,700 | $46,600 |
Source: Public Records
Map
Nearby Homes
- 25 Dwight St
- 430 Ocean Ave
- 35 Stegman St
- 418 Ocean Ave
- 63 Stegman St Unit B
- 48 Armstrong Ave
- 35 Wegman Pkwy
- 57 Wegman Pkwy
- 63 Wegman Pkwy
- 17 Freedom Place
- 29 Armstrong Ave Unit 1
- 93 Woodlawn Ave
- 87 Wegman Pkwy
- 8 Van Nostrand Ave
- 49 Bidwell Ave
- 95 Bidwell Ave
- 104 Wegman Pkwy
- 7 Stevens Ave
- 23 Bayview Ave
- 127 Wegman Pkwy
- 34 Fulton Ave
- 32 Fulton Ave
- 32 Fulton Ave Unit 2FM
- 30 Fulton Ave
- 28 Fulton Ave
- 2 Vreeland Place
- 44 Fulton Ave
- 44 Fulton Ave Unit 2
- 26 Fulton Ave Unit 1
- 4 Vreeland Place
- 46 Fulton Ave
- 6 Vreeland Place
- 24 Fulton Ave
- 1 Vreeland Place
- 48 Fulton Ave
- 35 Fulton Ave
- 37 Fulton Ave
- 33 Fulton Ave
- 33 Fulton Ave Unit 2
- 8 Vreeland Place