34 Gilbert St Dracut, MA 01826
Estimated Value: $512,594 - $608,000
3
Beds
2
Baths
1,050
Sq Ft
$538/Sq Ft
Est. Value
About This Home
This home is located at 34 Gilbert St, Dracut, MA 01826 and is currently estimated at $564,899, approximately $537 per square foot. 34 Gilbert St is a home located in Middlesex County with nearby schools including Joseph A. Campbell Elementary School, Richardson Middle School, and Dracut Senior High School.
Ownership History
Date
Name
Owned For
Owner Type
Purchase Details
Closed on
Jul 14, 2000
Sold by
Newton Ridge Inc
Bought by
Lipomi Lisa M
Current Estimated Value
Home Financials for this Owner
Home Financials are based on the most recent Mortgage that was taken out on this home.
Original Mortgage
$160,000
Interest Rate
8.5%
Mortgage Type
Purchase Money Mortgage
Purchase Details
Closed on
Jul 11, 1996
Sold by
Ra Delong T and Delong Russell
Bought by
Mcmanus Gloria A
Home Financials for this Owner
Home Financials are based on the most recent Mortgage that was taken out on this home.
Original Mortgage
$37,500
Interest Rate
7.98%
Mortgage Type
Purchase Money Mortgage
Purchase Details
Closed on
Feb 22, 1991
Sold by
Est Iolanda Taccone
Bought by
Delong Russell
Create a Home Valuation Report for This Property
The Home Valuation Report is an in-depth analysis detailing your home's value as well as a comparison with similar homes in the area
Home Values in the Area
Average Home Value in this Area
Purchase History
| Date | Buyer | Sale Price | Title Company |
|---|---|---|---|
| Lipomi Lisa M | $200,488 | -- | |
| Mcmanus Gloria A | $30,000 | -- | |
| Delong Russell | $10,000 | -- |
Source: Public Records
Mortgage History
| Date | Status | Borrower | Loan Amount |
|---|---|---|---|
| Open | Delong Russell | $162,500 | |
| Closed | Delong Russell | $160,000 | |
| Previous Owner | Delong Russell | $37,500 | |
| Closed | Delong Russell | $65,000 |
Source: Public Records
Tax History
| Year | Tax Paid | Tax Assessment Tax Assessment Total Assessment is a certain percentage of the fair market value that is determined by local assessors to be the total taxable value of land and additions on the property. | Land | Improvement |
|---|---|---|---|---|
| 2025 | $4,839 | $478,200 | $187,300 | $290,900 |
| 2024 | $4,928 | $471,600 | $178,400 | $293,200 |
| 2023 | $4,932 | $425,900 | $155,100 | $270,800 |
| 2022 | $4,482 | $364,700 | $141,000 | $223,700 |
| 2021 | $4,425 | $340,100 | $128,100 | $212,000 |
| 2020 | $4,164 | $311,900 | $124,300 | $187,600 |
| 2019 | $4,168 | $303,100 | $118,300 | $184,800 |
| 2018 | $5,824 | $284,500 | $118,300 | $166,200 |
| 2017 | $3,856 | $284,500 | $118,300 | $166,200 |
| 2016 | $3,731 | $251,400 | $113,700 | $137,700 |
| 2015 | $3,601 | $241,200 | $113,700 | $127,500 |
| 2014 | $3,431 | $236,800 | $113,700 | $123,100 |
Source: Public Records
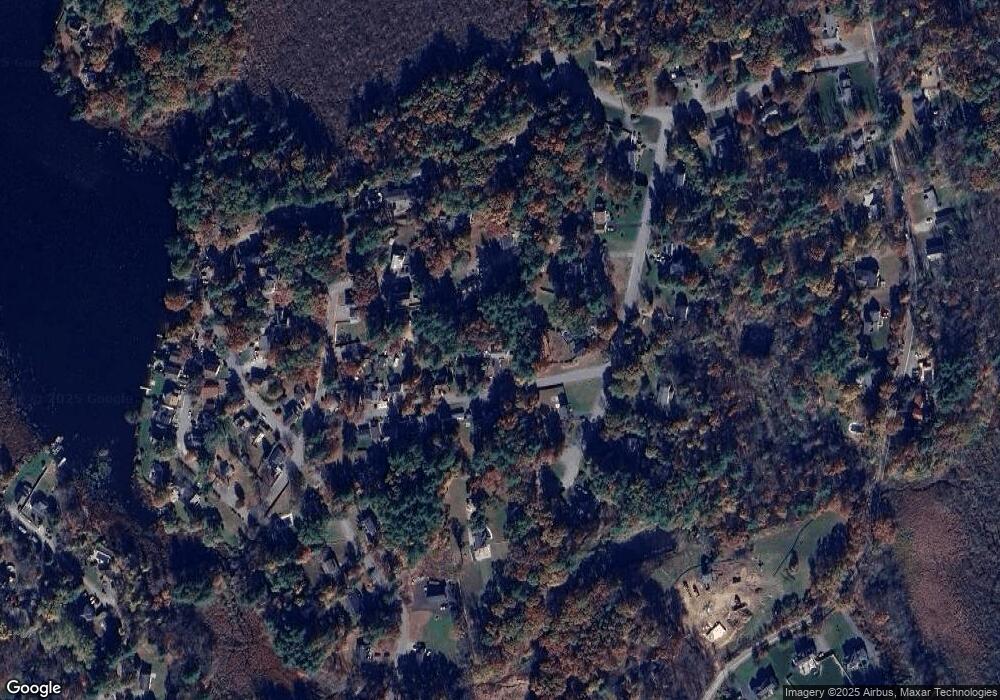
Map
Nearby Homes
Your Personal Tour Guide
Ask me questions while you tour the home.