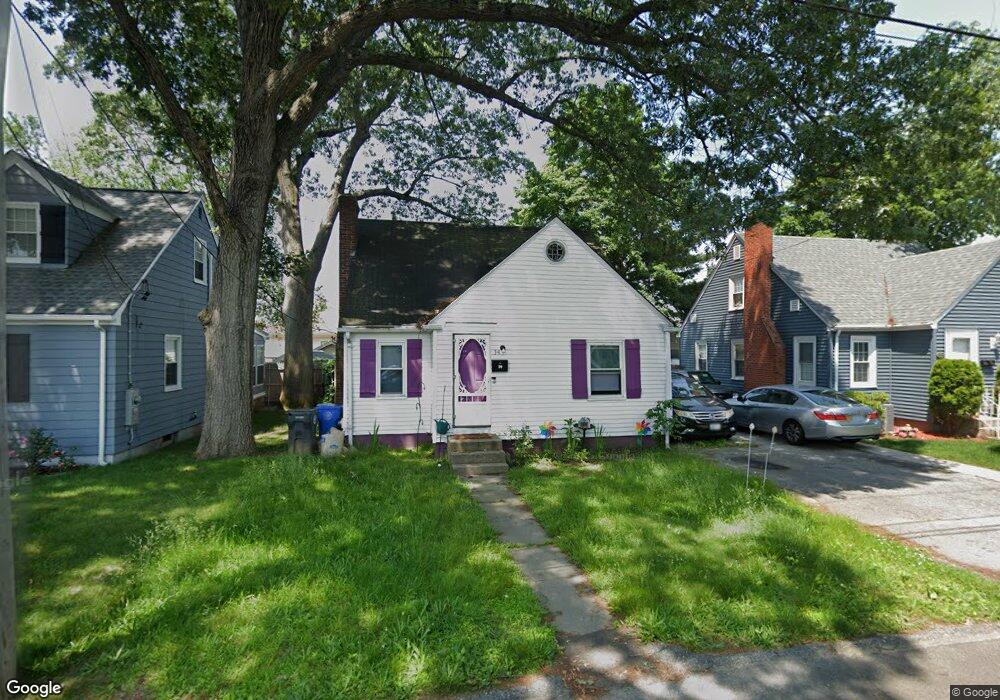
34 Grantland Rd Cranston, RI 02910
Stadium NeighborhoodEstimated Value: $317,000 - $378,000
3
Beds
1
Bath
1,100
Sq Ft
$325/Sq Ft
Est. Value
About This Home
This home is located at 34 Grantland Rd, Cranston, RI 02910 and is currently estimated at $357,479, approximately $324 per square foot. 34 Grantland Rd is a home located in Providence County with nearby schools including Stadium Elementary School, Hugh B. Bain Middle School, and Cranston High School East.
Ownership History
Date
Name
Owned For
Owner Type
Purchase Details
Closed on
Sep 15, 1998
Sold by
Morris Stephen R
Bought by
York Steven M and York Jeanne
Current Estimated Value
Home Financials for this Owner
Home Financials are based on the most recent Mortgage that was taken out on this home.
Original Mortgage
$77,639
Outstanding Balance
$16,197
Interest Rate
6.92%
Estimated Equity
$341,282
Purchase Details
Closed on
May 11, 1993
Sold by
Kelly Claire Est
Bought by
Morris Stephen R and Morris Julie
Home Financials for this Owner
Home Financials are based on the most recent Mortgage that was taken out on this home.
Original Mortgage
$85,000
Interest Rate
7.47%
Create a Home Valuation Report for This Property
The Home Valuation Report is an in-depth analysis detailing your home's value as well as a comparison with similar homes in the area
Home Values in the Area
Average Home Value in this Area
Purchase History
| Date | Buyer | Sale Price | Title Company |
|---|---|---|---|
| York Steven M | $78,000 | -- | |
| Morris Stephen R | $89,500 | -- |
Source: Public Records
Mortgage History
| Date | Status | Borrower | Loan Amount |
|---|---|---|---|
| Open | Morris Stephen R | $77,639 | |
| Previous Owner | Morris Stephen R | $85,000 |
Source: Public Records
Tax History
| Year | Tax Paid | Tax Assessment Tax Assessment Total Assessment is a certain percentage of the fair market value that is determined by local assessors to be the total taxable value of land and additions on the property. | Land | Improvement |
|---|---|---|---|---|
| 2025 | $3,945 | $284,200 | $94,200 | $190,000 |
| 2024 | $3,799 | $279,100 | $94,200 | $184,900 |
| 2023 | $3,725 | $197,100 | $64,900 | $132,200 |
| 2022 | $3,648 | $197,100 | $64,900 | $132,200 |
| 2021 | $3,548 | $197,100 | $64,900 | $132,200 |
| 2020 | $3,392 | $163,300 | $61,700 | $101,600 |
| 2019 | $3,392 | $163,300 | $61,700 | $101,600 |
| 2018 | $3,313 | $163,300 | $61,700 | $101,600 |
| 2017 | $3,007 | $131,100 | $45,500 | $85,600 |
| 2016 | $2,943 | $131,100 | $45,500 | $85,600 |
| 2015 | $2,943 | $131,100 | $45,500 | $85,600 |
| 2014 | $2,887 | $126,400 | $45,500 | $80,900 |
Source: Public Records
Map
Nearby Homes
Your Personal Tour Guide
Ask me questions while you tour the home.