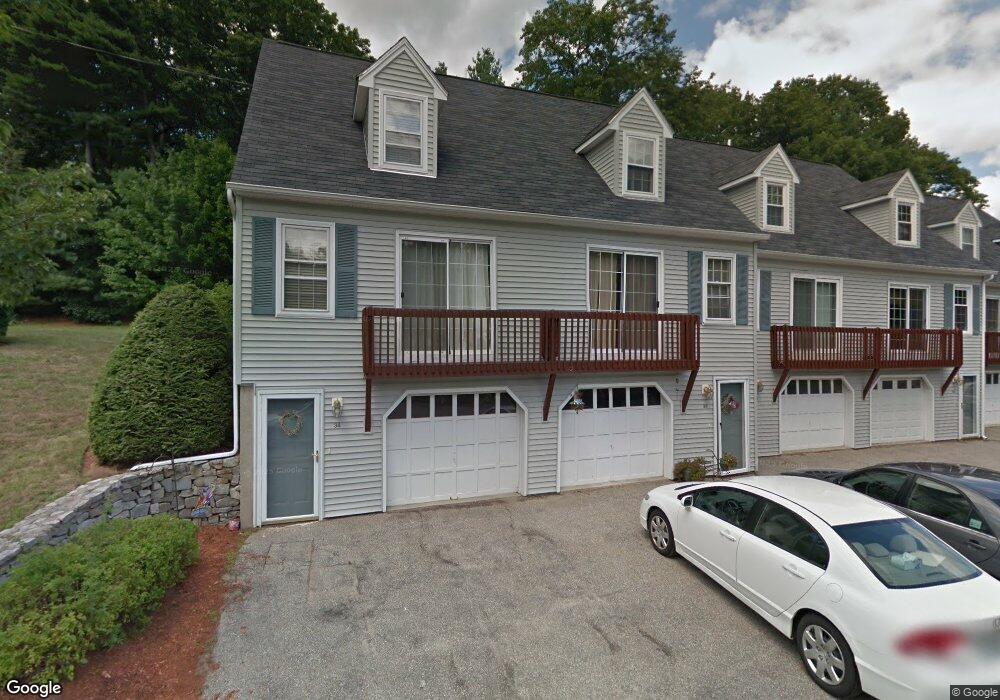
34 Hawkstead Hollow Unit U35 Nashua, NH 03063
Northwest Nashua NeighborhoodEstimated Value: $331,887 - $364,000
2
Beds
1
Bath
1,022
Sq Ft
$343/Sq Ft
Est. Value
About This Home
This home is located at 34 Hawkstead Hollow Unit U35, Nashua, NH 03063 and is currently estimated at $350,472, approximately $342 per square foot. 34 Hawkstead Hollow Unit U35 is a home located in Hillsborough County with nearby schools including Broad Street Elementary School, Pennichuck Middle School, and Nashua High School North.
Ownership History
Date
Name
Owned For
Owner Type
Purchase Details
Closed on
Dec 28, 2022
Sold by
Oneil David M and Oneil Patricia
Bought by
Oneil David M
Current Estimated Value
Home Financials for this Owner
Home Financials are based on the most recent Mortgage that was taken out on this home.
Original Mortgage
$224,000
Outstanding Balance
$216,449
Interest Rate
6.49%
Mortgage Type
Stand Alone Refi Refinance Of Original Loan
Estimated Equity
$134,023
Purchase Details
Closed on
Oct 3, 2007
Sold by
Gamache Ryan P and Gamache Tracey L
Bought by
Oneil David M
Home Financials for this Owner
Home Financials are based on the most recent Mortgage that was taken out on this home.
Original Mortgage
$187,150
Interest Rate
6.59%
Create a Home Valuation Report for This Property
The Home Valuation Report is an in-depth analysis detailing your home's value as well as a comparison with similar homes in the area
Home Values in the Area
Average Home Value in this Area
Purchase History
| Date | Buyer | Sale Price | Title Company |
|---|---|---|---|
| Oneil David M | -- | None Available | |
| Oneil David M | -- | None Available | |
| Oneil David M | $197,000 | -- | |
| Oneil David M | $197,000 | -- |
Source: Public Records
Mortgage History
| Date | Status | Borrower | Loan Amount |
|---|---|---|---|
| Open | Oneil David M | $224,000 | |
| Closed | Oneil David M | $224,000 | |
| Previous Owner | Oneil David M | $176,600 | |
| Previous Owner | Oneil David M | $187,150 | |
| Previous Owner | Oneil David M | $30,000 |
Source: Public Records
Tax History Compared to Growth
Tax History
| Year | Tax Paid | Tax Assessment Tax Assessment Total Assessment is a certain percentage of the fair market value that is determined by local assessors to be the total taxable value of land and additions on the property. | Land | Improvement |
|---|---|---|---|---|
| 2024 | $4,516 | $284,000 | $0 | $284,000 |
| 2023 | $4,333 | $237,700 | $0 | $237,700 |
| 2022 | $4,295 | $237,700 | $0 | $237,700 |
| 2021 | $3,899 | $167,900 | $0 | $167,900 |
| 2020 | $3,796 | $167,900 | $0 | $167,900 |
| 2019 | $3,654 | $167,900 | $0 | $167,900 |
| 2018 | $3,561 | $167,900 | $0 | $167,900 |
| 2017 | $2,749 | $106,600 | $0 | $106,600 |
| 2016 | $2,672 | $106,600 | $0 | $106,600 |
| 2015 | $2,615 | $106,600 | $0 | $106,600 |
| 2014 | $2,564 | $106,600 | $0 | $106,600 |
Source: Public Records
Map
Nearby Homes
- 38 Highbridge Hill Rd Unit 186
- 26 Andover Down Unit 276
- 123 Cannongate III
- 74 Profile Cir
- 75 Deerwood Dr Unit B
- 77 Deerwood Dr Unit E
- 5 Dumaine Ave Unit B
- 5 Dumaine Ave Unit N
- 66 Tinker Rd
- 7 Robert Dr
- 33 Ferry Rd
- 218 Millwright Dr Unit 218
- 47 Hanna Cir Unit 47
- 47 Hanna Cir
- 201 Millwright Dr
- 19 Dunloggin Rd
- 3 Roedean Dr Unit C-207
- 5 Chatfield Dr Unit U18
- 2 New Haven Dr Unit E303
- 4 Jared Cir Unit U21
- 36 Hawkstead Hollow Unit U36
- 38 Hawkstead Hollow Unit U37
- 40 Hawkstead Hollow Unit U38
- 42 Hawkstead Hollow Unit U39
- 44 Hawkstead Hollow Unit U40
- 32 Hawkstead Hollow Unit U28
- 30 Hawkstead Hollow Unit U27
- 30 Hawkstead Hollow Unit 27
- 33 Hawkstead Hollow Unit U29
- 35 Hawkstead Hollow Unit U30
- 37 Hawkstead Hollow Unit U31
- 31 Hawkstead Hollow Unit U22
- 39 Hawkstead Hollow Unit U32
- 28 Hawkstead Hollow Unit U26
- 29 Hawkstead Hollow Unit U21
- 41 Hawkstead Hollow Unit U33
- 40 Rd
- 26 Hawkstead Hollow Unit U25
- 43 Hawkstead Hollow Unit U34
- 27 Hawkstead Hollow Unit U20