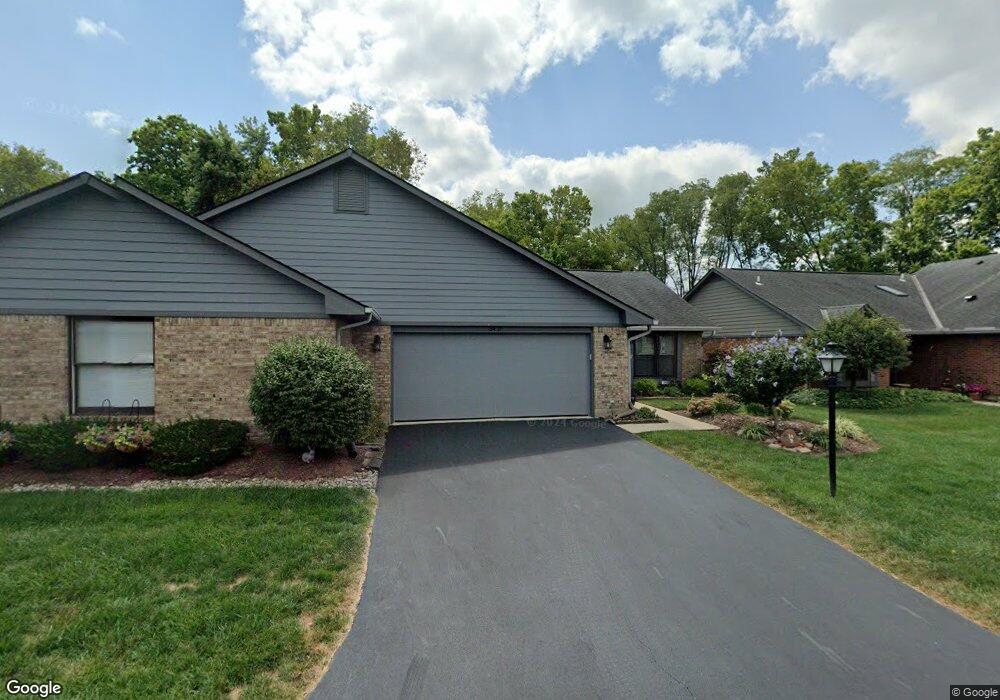
34 Shaker Run Rd Lebanon, OH 45036
Estimated Value: $293,000 - $305,000
3
Beds
2
Baths
1,456
Sq Ft
$206/Sq Ft
Est. Value
About This Home
This home is located at 34 Shaker Run Rd, Lebanon, OH 45036 and is currently estimated at $299,651, approximately $205 per square foot. 34 Shaker Run Rd is a home located in Warren County with nearby schools including Bowman Primary School, Berry Intermediate School, and Donovan Elementary School.
Ownership History
Date
Name
Owned For
Owner Type
Purchase Details
Closed on
Aug 16, 2017
Sold by
Villars Richard Wayne
Bought by
Kendrick Thomas L and Kendrick Felicia M
Current Estimated Value
Home Financials for this Owner
Home Financials are based on the most recent Mortgage that was taken out on this home.
Original Mortgage
$1,428,000
Outstanding Balance
$763,722
Interest Rate
3.96%
Mortgage Type
New Conventional
Estimated Equity
-$464,071
Purchase Details
Closed on
Apr 13, 2000
Sold by
Hawke Maynard C
Bought by
Villars John R and Villars Revilla B
Purchase Details
Closed on
Jan 4, 1993
Sold by
Oberer Development Co
Bought by
Maynard Hawke and Maynard C.
Purchase Details
Closed on
Oct 29, 1992
Sold by
Oberer Development Co
Bought by
Oberer Development Co
Create a Home Valuation Report for This Property
The Home Valuation Report is an in-depth analysis detailing your home's value as well as a comparison with similar homes in the area
Home Values in the Area
Average Home Value in this Area
Purchase History
| Date | Buyer | Sale Price | Title Company |
|---|---|---|---|
| Kendrick Thomas L | $178,500 | None Available | |
| Villars John R | $155,000 | -- | |
| Maynard Hawke | $119,500 | -- | |
| Oberer Development Co | -- | -- |
Source: Public Records
Mortgage History
| Date | Status | Borrower | Loan Amount |
|---|---|---|---|
| Open | Kendrick Thomas L | $1,428,000 |
Source: Public Records
Tax History Compared to Growth
Tax History
| Year | Tax Paid | Tax Assessment Tax Assessment Total Assessment is a certain percentage of the fair market value that is determined by local assessors to be the total taxable value of land and additions on the property. | Land | Improvement |
|---|---|---|---|---|
| 2024 | $3,625 | $87,290 | $19,250 | $68,040 |
| 2023 | $3,288 | $71,144 | $10,762 | $60,382 |
| 2022 | $3,427 | $71,145 | $10,763 | $60,382 |
| 2021 | $3,239 | $71,145 | $10,763 | $60,382 |
| 2020 | $3,118 | $57,841 | $8,750 | $49,091 |
| 2019 | $3,132 | $57,841 | $8,750 | $49,091 |
| 2018 | $2,685 | $57,841 | $8,750 | $49,091 |
| 2017 | $2,268 | $52,605 | $8,092 | $44,513 |
| 2016 | $2,340 | $52,605 | $8,092 | $44,513 |
| 2015 | $2,357 | $52,605 | $8,092 | $44,513 |
| 2014 | $2,262 | $49,160 | $7,560 | $41,600 |
| 2013 | $2,176 | $56,880 | $8,750 | $48,130 |
Source: Public Records
Map
Nearby Homes
- 34 Shaker Run Rd
- 34 Shaker Run Rd Unit B
- 35 Shaker Run Rd
- 35 Shaker Run Rd
- 35 Shaker Run Rd Unit A
- 35 Shaker Run Rd Unit B
- 35 Shaker Run Rd Unit 4395-3
- 33 Shaker Run Rd
- 33 Shaker Run Rd
- 33 Shaker Run Rd Unit A
- 31 Shaker Run Rd
- 31 Shaker Run Rd
- 30 Shaker Run Rd
- 30 Shaker Run Rd
- 32 Shaker Run Rd
- 32 Shaker Run Rd
- 32 Shaker Run Rd Unit B
- 32 Shaker Run Rd Unit A
- 32 Shaker Run Rd Unit 4395-3
- 1 Shaker Run Rd