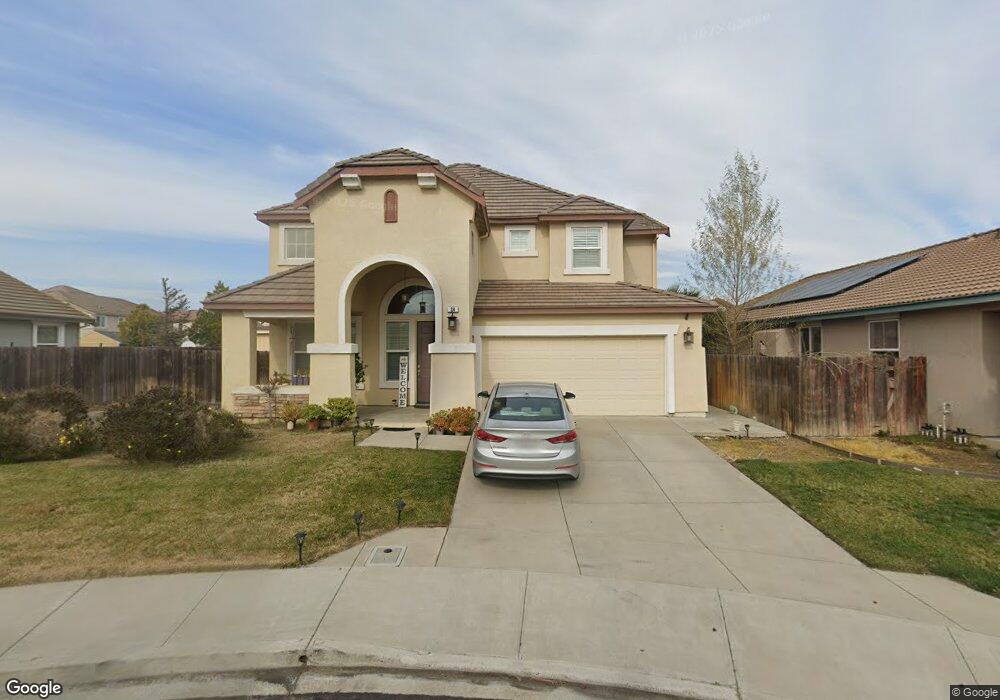
34 Vignola Ct Oakley, CA 94561
Estimated Value: $694,230 - $750,000
4
Beds
4
Baths
2,735
Sq Ft
$265/Sq Ft
Est. Value
About This Home
This home is located at 34 Vignola Ct, Oakley, CA 94561 and is currently estimated at $725,808, approximately $265 per square foot. 34 Vignola Ct is a home located in Contra Costa County with nearby schools including Iron House Elementary School, Delta Vista Middle School, and Freedom High School.
Ownership History
Date
Name
Owned For
Owner Type
Purchase Details
Closed on
Jun 9, 2017
Sold by
Uhey Edwin J
Bought by
See Wesley R
Current Estimated Value
Home Financials for this Owner
Home Financials are based on the most recent Mortgage that was taken out on this home.
Original Mortgage
$400,000
Outstanding Balance
$332,717
Interest Rate
4.02%
Mortgage Type
New Conventional
Estimated Equity
$393,091
Purchase Details
Closed on
Jul 16, 2009
Sold by
Hsbc Bank Usa Na
Bought by
Uhey Edwin J
Home Financials for this Owner
Home Financials are based on the most recent Mortgage that was taken out on this home.
Original Mortgage
$284,747
Interest Rate
5.59%
Mortgage Type
FHA
Purchase Details
Closed on
Apr 13, 2009
Sold by
Cianfichi Barry
Bought by
Hsbc Bank Usa Na
Purchase Details
Closed on
Aug 14, 2006
Sold by
Western Pacific Housing Inc
Bought by
Cianfichi Barry
Home Financials for this Owner
Home Financials are based on the most recent Mortgage that was taken out on this home.
Original Mortgage
$436,755
Interest Rate
5.75%
Mortgage Type
Purchase Money Mortgage
Create a Home Valuation Report for This Property
The Home Valuation Report is an in-depth analysis detailing your home's value as well as a comparison with similar homes in the area
Home Values in the Area
Average Home Value in this Area
Purchase History
| Date | Buyer | Sale Price | Title Company |
|---|---|---|---|
| See Wesley R | $505,000 | First American Title Company | |
| Uhey Edwin J | $290,000 | Lsi Title Company Ca | |
| Hsbc Bank Usa Na | $210,645 | None Available | |
| Cianfichi Barry | $546,000 | Placer Title Company |
Source: Public Records
Mortgage History
| Date | Status | Borrower | Loan Amount |
|---|---|---|---|
| Open | See Wesley R | $400,000 | |
| Previous Owner | Uhey Edwin J | $284,747 | |
| Previous Owner | Cianfichi Barry | $436,755 |
Source: Public Records
Tax History
| Year | Tax Paid | Tax Assessment Tax Assessment Total Assessment is a certain percentage of the fair market value that is determined by local assessors to be the total taxable value of land and additions on the property. | Land | Improvement |
|---|---|---|---|---|
| 2025 | $11,983 | $586,089 | $104,449 | $481,640 |
| 2024 | $11,622 | $574,598 | $102,401 | $472,197 |
| 2023 | $11,622 | $563,333 | $100,394 | $462,939 |
| 2022 | $11,455 | $552,288 | $98,426 | $453,862 |
| 2021 | $11,232 | $541,460 | $96,497 | $444,963 |
| 2019 | $10,832 | $525,402 | $93,636 | $431,766 |
| 2018 | $10,568 | $515,100 | $91,800 | $423,300 |
| 2017 | $8,284 | $322,537 | $33,363 | $289,174 |
| 2016 | $7,976 | $316,213 | $32,709 | $283,504 |
| 2015 | $7,947 | $311,464 | $32,218 | $279,246 |
| 2014 | $7,861 | $305,363 | $31,587 | $273,776 |
Source: Public Records
Map
Nearby Homes
- 30 Vignola Ct
- 10 Da Vinci Ct
- 4736 Mammouth Ln
- 210 W Cypress Rd Unit 1
- 53 Puffin Cir
- 30 Renoir Ct
- 369 Parkfield Way
- 288 Cashew Ln
- 22 Matisse Ct
- 208 Littleton St
- 809 Bluestone Dr
- 330 W Cypress Rd
- 624 Brinwood Way
- 409 Hazelnut Dr
- 732 Westmoor Cir
- 1210 Quail Valley Run
- 629 Channel Cir
- 459 Hazelnut Dr
- 614 Channel Cir
- 618 Channel Cir
Your Personal Tour Guide
Ask me questions while you tour the home.